Copyright
©The Author(s) 2025.
World J Exp Med. Jun 20, 2025; 15(2): 102897
Published online Jun 20, 2025. doi: 10.5493/wjem.v15.i2.102897
Published online Jun 20, 2025. doi: 10.5493/wjem.v15.i2.102897
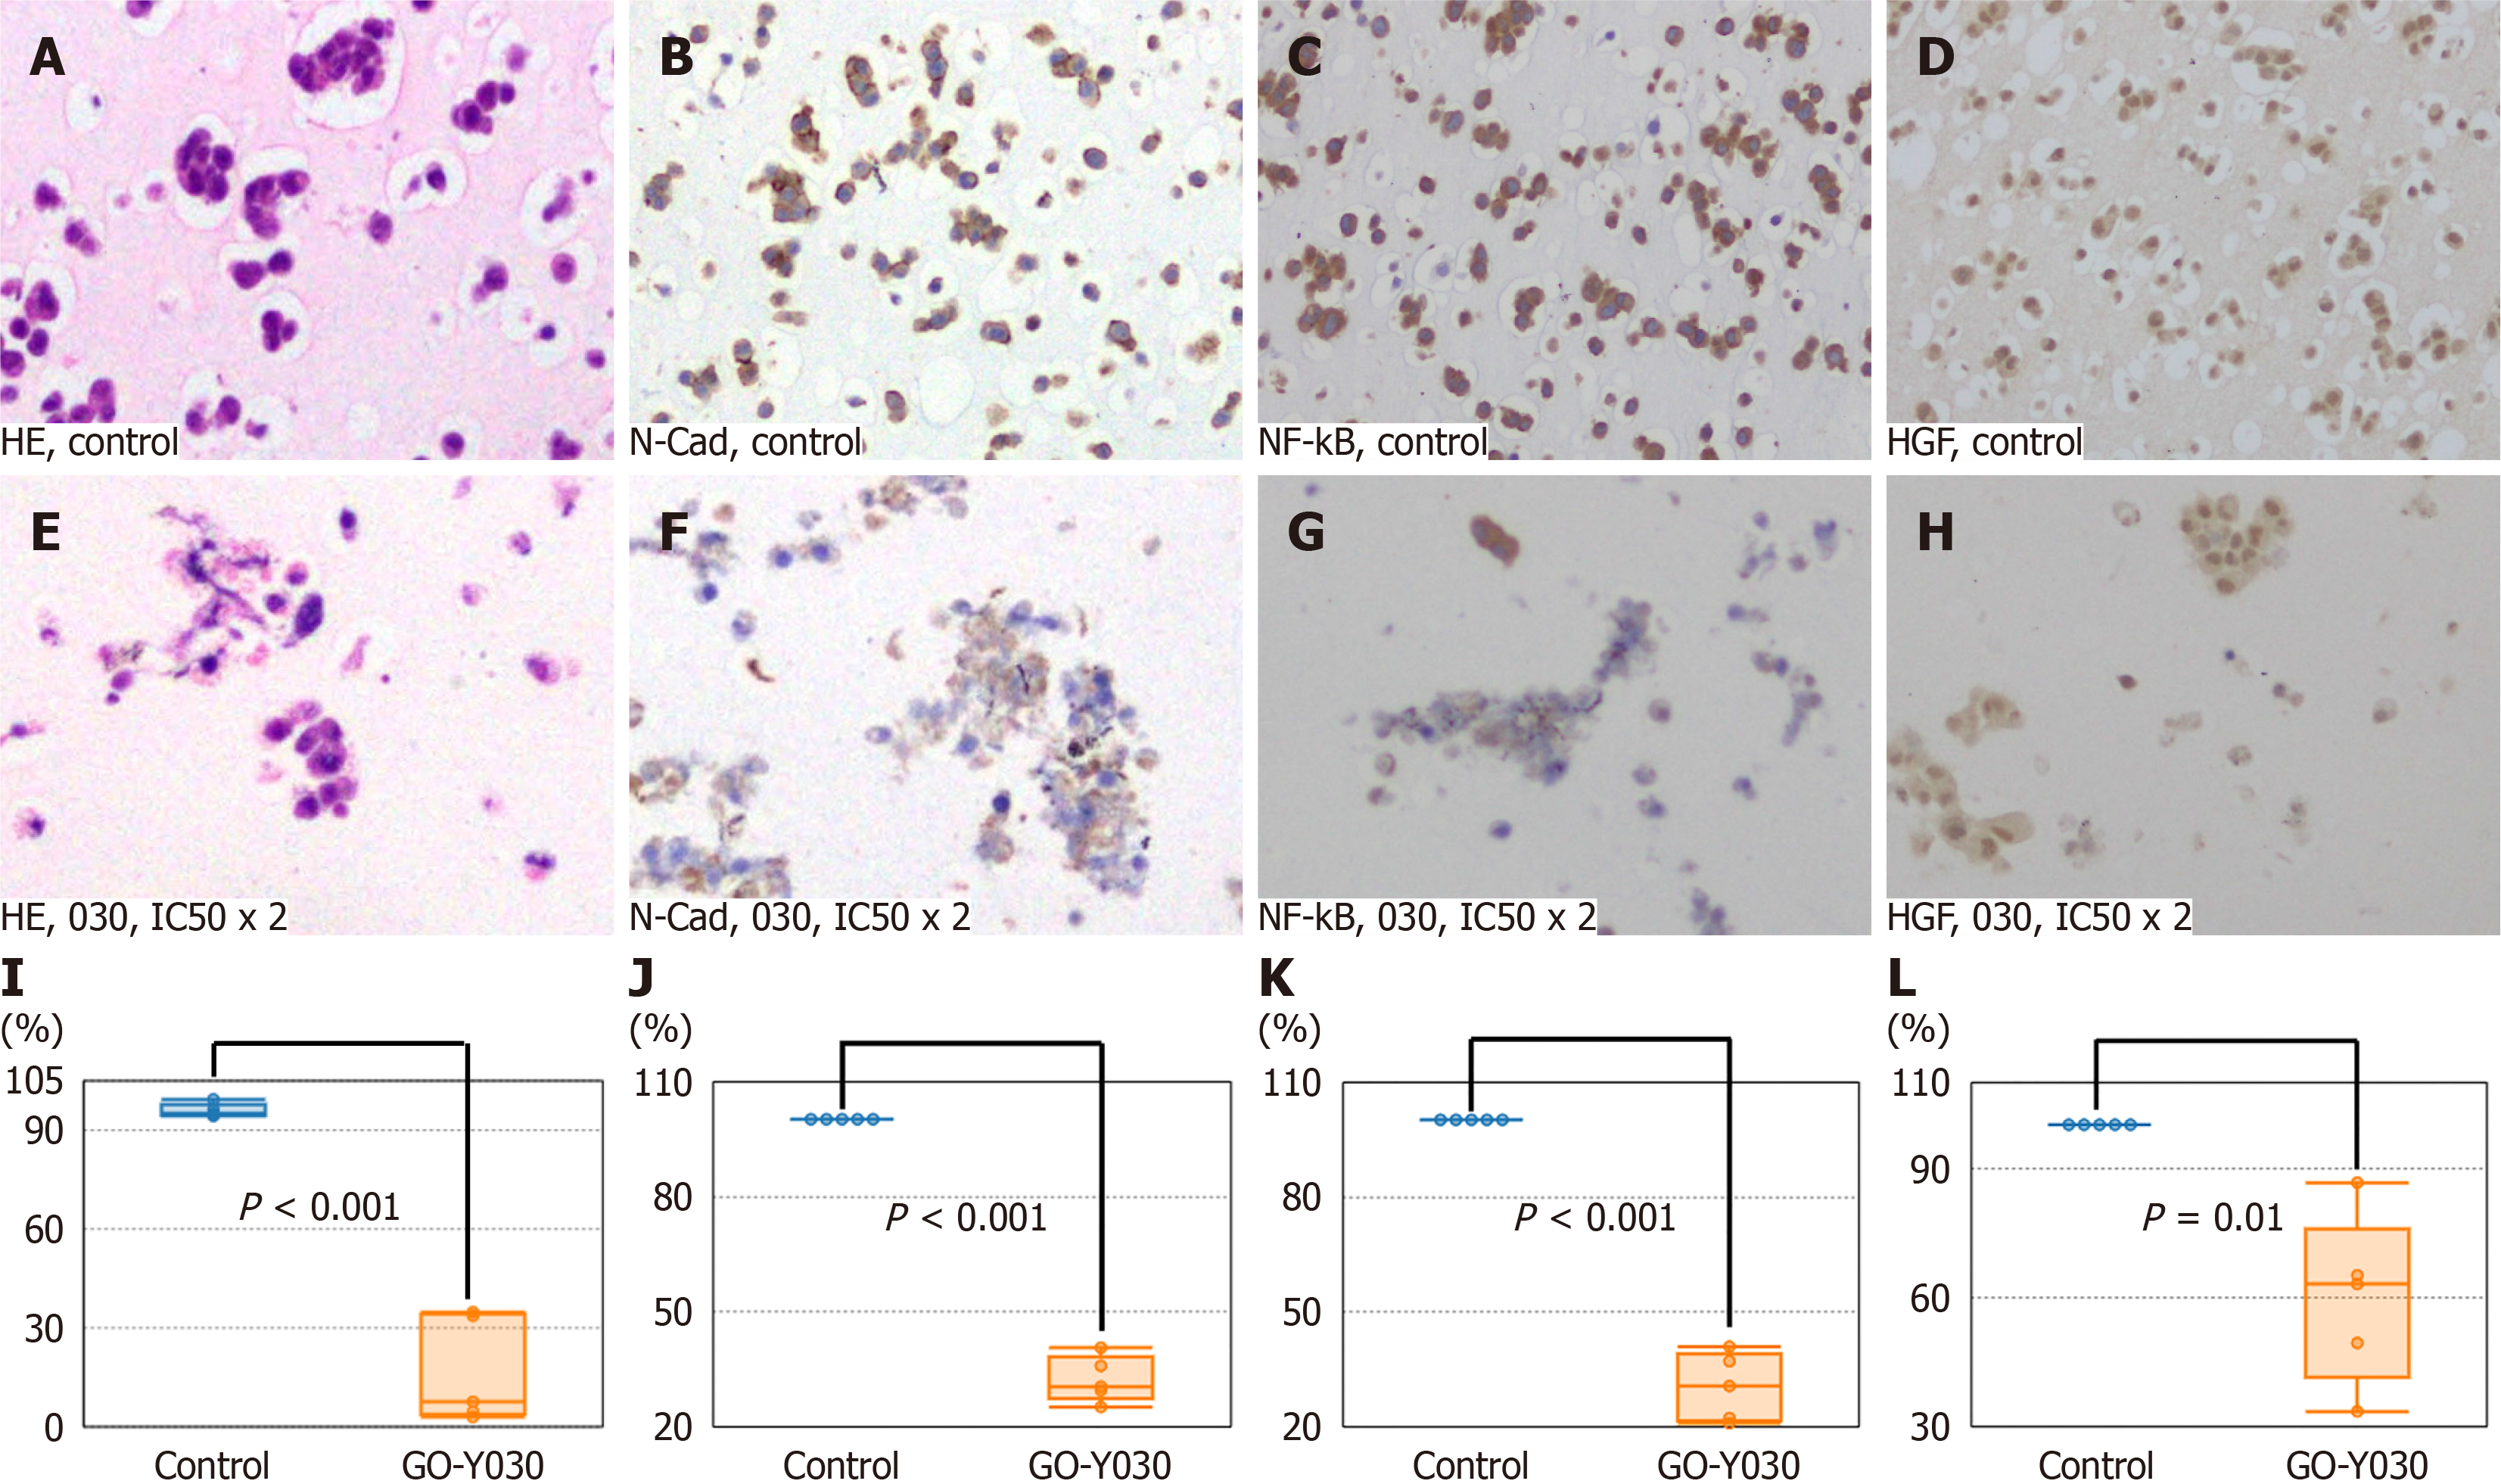
Figure 4 Inhibition of molecular targets in meningioma cell lines (IOMM-Lee) with GO-Y030 in vitro.
A: Hematoxylin and eosin (HE) stains of IOMM-Lee treated with DMSO alone (control); B: Immunohistochemistry (IHC) of the N-Cadherin (N-Cad) in the control; C: IHC of the hepatocellular growth factor (HGF) in the control; D: IHC of nuclear factor kappa-B p65 (NF-kB) in the control; E: HE stains of IOMM-Lee treated with GO-Y030 at twice concentration of the 50% inhibitory concentration (IC50 × 2); F: IHC of the N-Cad in IOMM-Lee treated with GO-Y030 at IC50 x 2; G: IHC of NF-kB in IOMM-Lee treated with GO-Y030 at IC50 × 2; H: IHC of the HGF in IOMM-Lee treated with GO-Y030 at IC50 × 2; I: The percentage of normal appearance cells in IOMM-Lee treated with GO-Y030 at IC50 × 2. J: The percentage of positive cells for N-Cad in IOMM-Lee treated with GO-Y030 at IC50 × 2; K: The percentage of positive cells for NF-kB in IOMM-Lee treated with GO-Y030 at IC50 × 2; L: The percentage of positive cells for HGF in IOMM-Lee treated with GO-Y030 at IC50 × 2.
- Citation: Terasawa A, Shimazu K, Nanjo H, Miura M, Shibata H. Diarylpentanoid, a curcumin analog, inhibits malignant meningioma growth in both in vitro and in vivo models. World J Exp Med 2025; 15(2): 102897
- URL: https://www.wjgnet.com/2220-315x/full/v15/i2/102897.htm
- DOI: https://dx.doi.org/10.5493/wjem.v15.i2.102897


