Copyright
©The Author(s) 2025.
World J Exp Med. Jun 20, 2025; 15(2): 102761
Published online Jun 20, 2025. doi: 10.5493/wjem.v15.i2.102761
Published online Jun 20, 2025. doi: 10.5493/wjem.v15.i2.102761
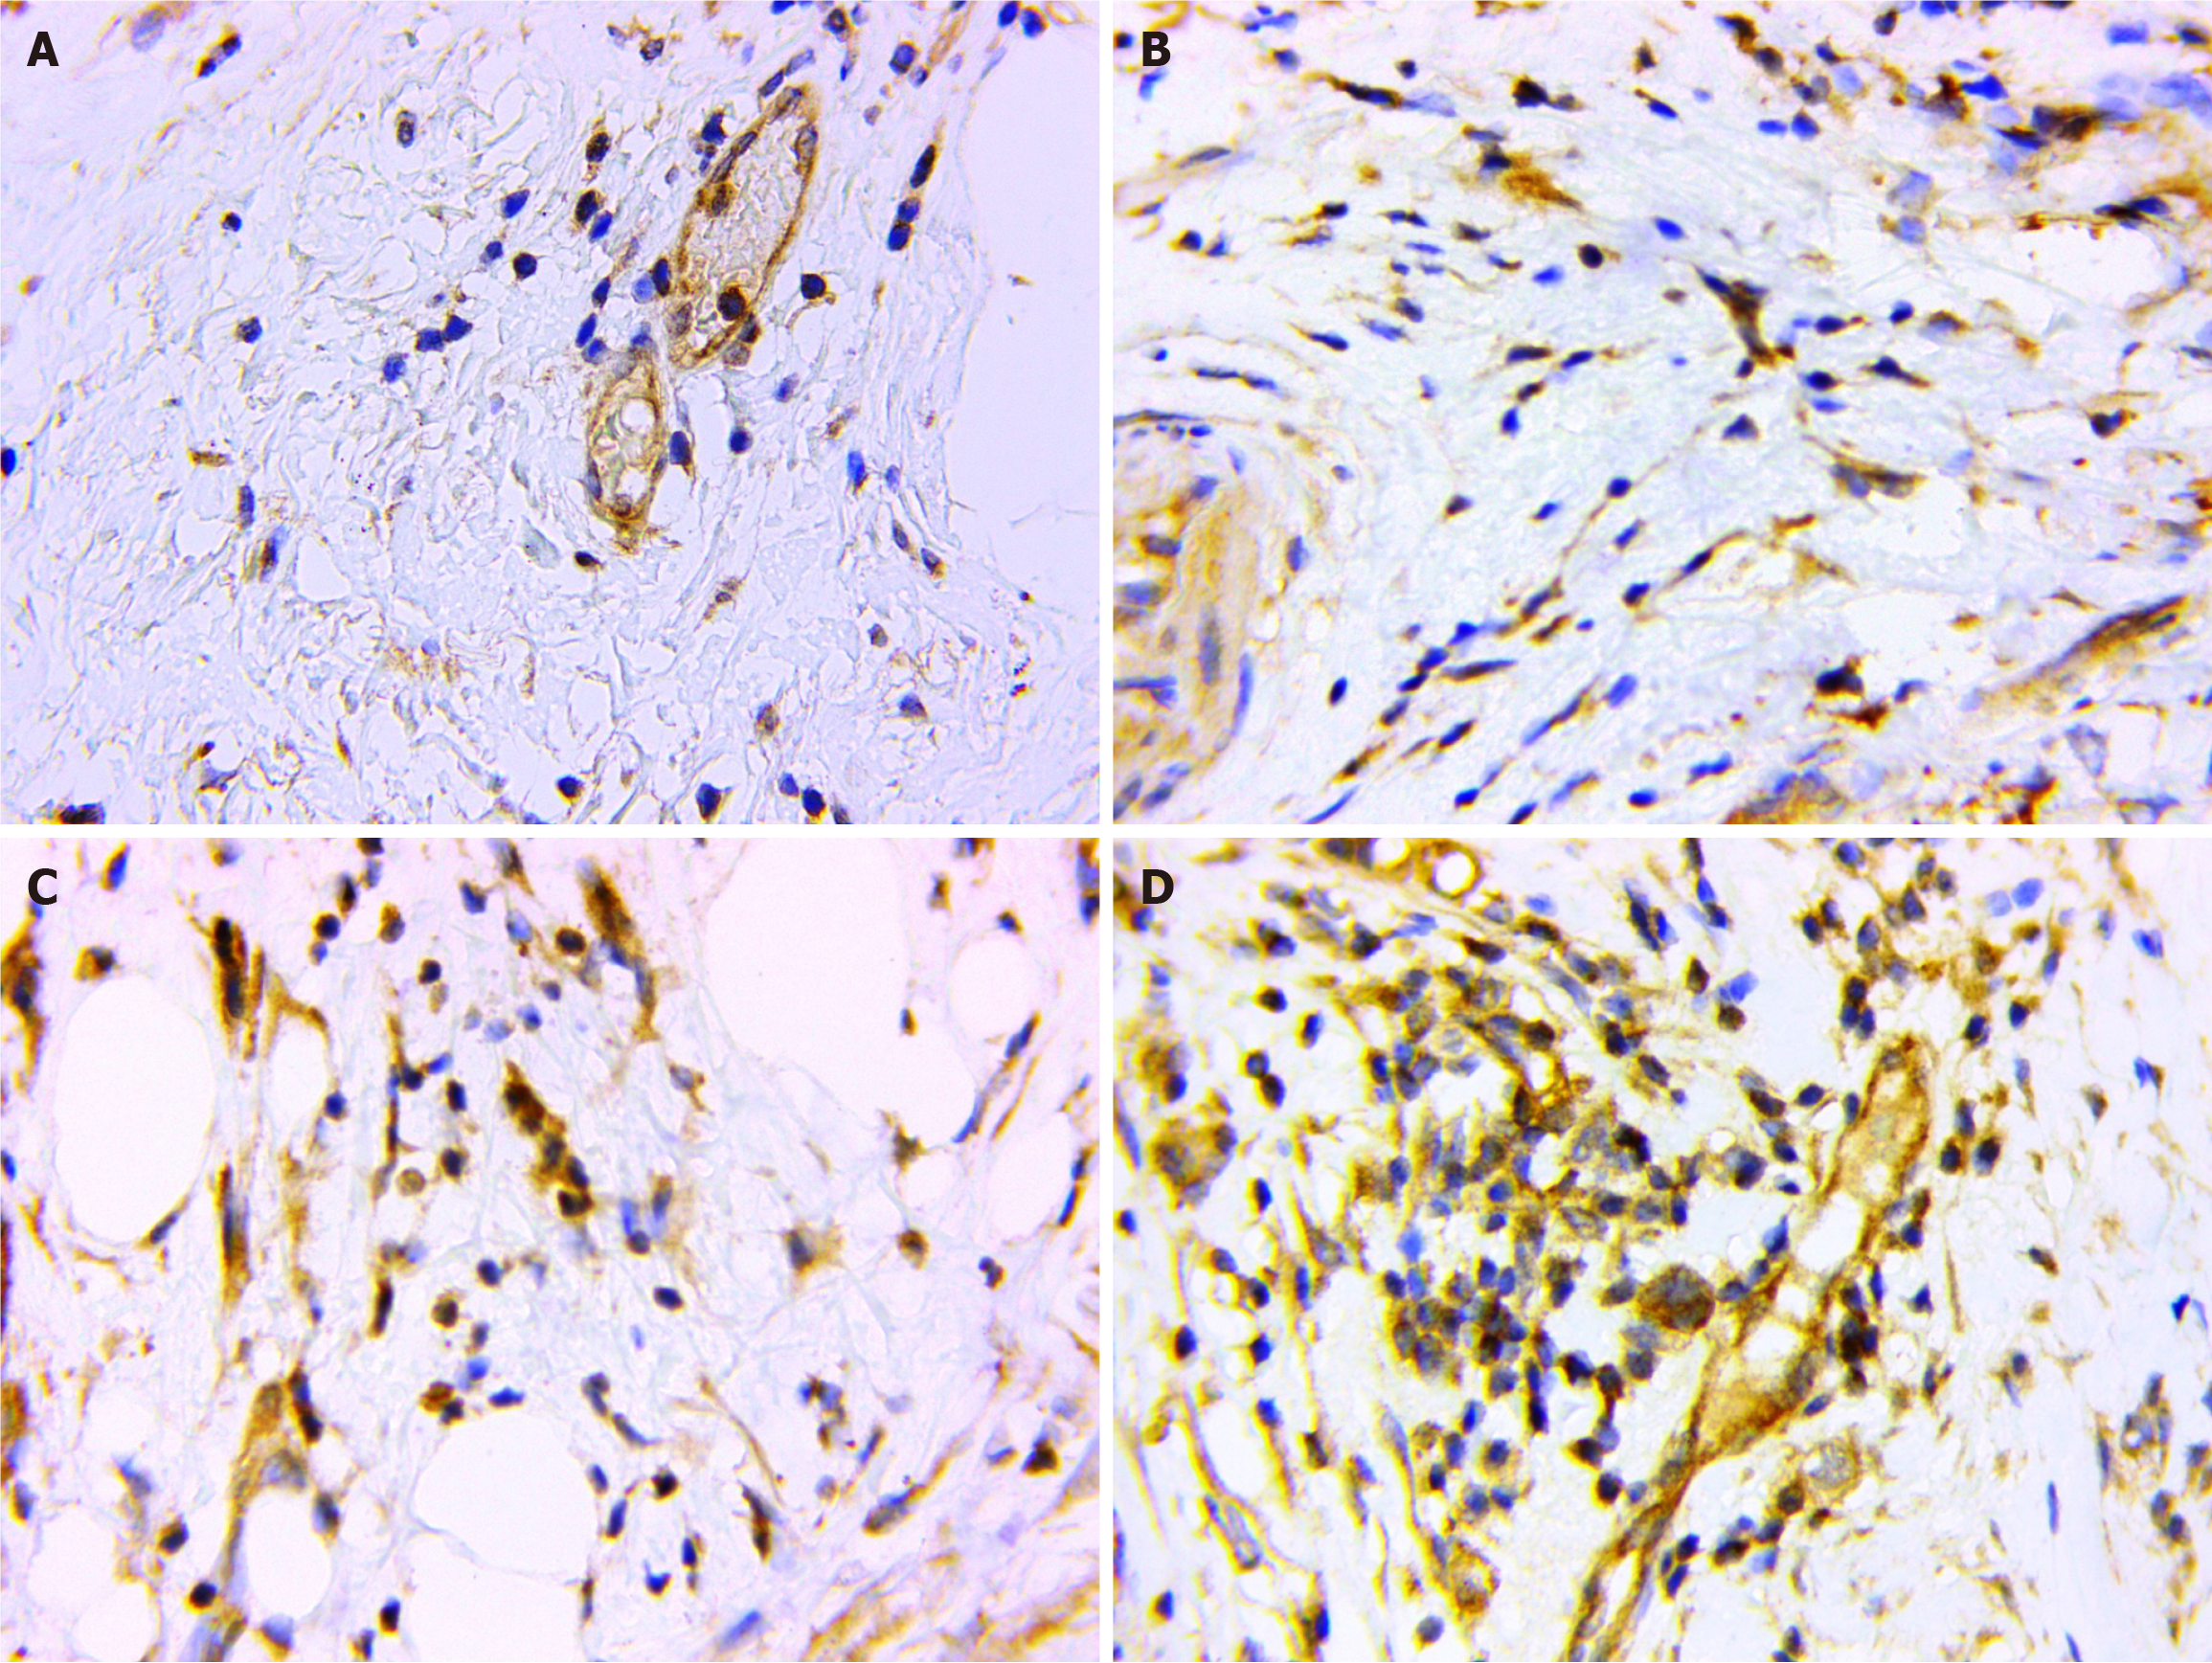
Figure 1 Assessment of the programmed cell death protein 1 ligand 1-positive LF score.
A: Relative density of immune cells (ICs) – 2; percentage of programmed cell death protein 1 ligand 1-positive (PDCD1 LG1+) ICs - 1. PDCD1 LG1+ LF score = 2 (1 × 2); B: Relative density of ICs - 2; percentage of PDCD1 LG1+ ICs - 1. PDCD1 LG1+ LF score = 2 (2 × 1); C: Relative density of ICs - 3; percentage of PDCD1 LG1+ ICs - 2. The PDCD1 LG1+ LF score = 6 (3 × 2); D: Relative density of ICs - 3; percentage of PDCD1 LG1+ ICs - 4. PDCD1 LG1+ LF score = 12 (3 × 4). Immunohistochemistry staining with antibodies against PDCD1 LG1, 800 ×.
- Citation: Zubareva EY, Senchukova MA, Saidler NV. Cytoplasmic and nuclear programmed death ligand 1 expression in peritumoral stromal cells in breast cancer: Prognostic and predictive value. World J Exp Med 2025; 15(2): 102761
- URL: https://www.wjgnet.com/2220-315x/full/v15/i2/102761.htm
- DOI: https://dx.doi.org/10.5493/wjem.v15.i2.102761


