Copyright
©The Author(s) 2025.
World J Exp Med. Jun 20, 2025; 15(2): 100166
Published online Jun 20, 2025. doi: 10.5493/wjem.v15.i2.100166
Published online Jun 20, 2025. doi: 10.5493/wjem.v15.i2.100166
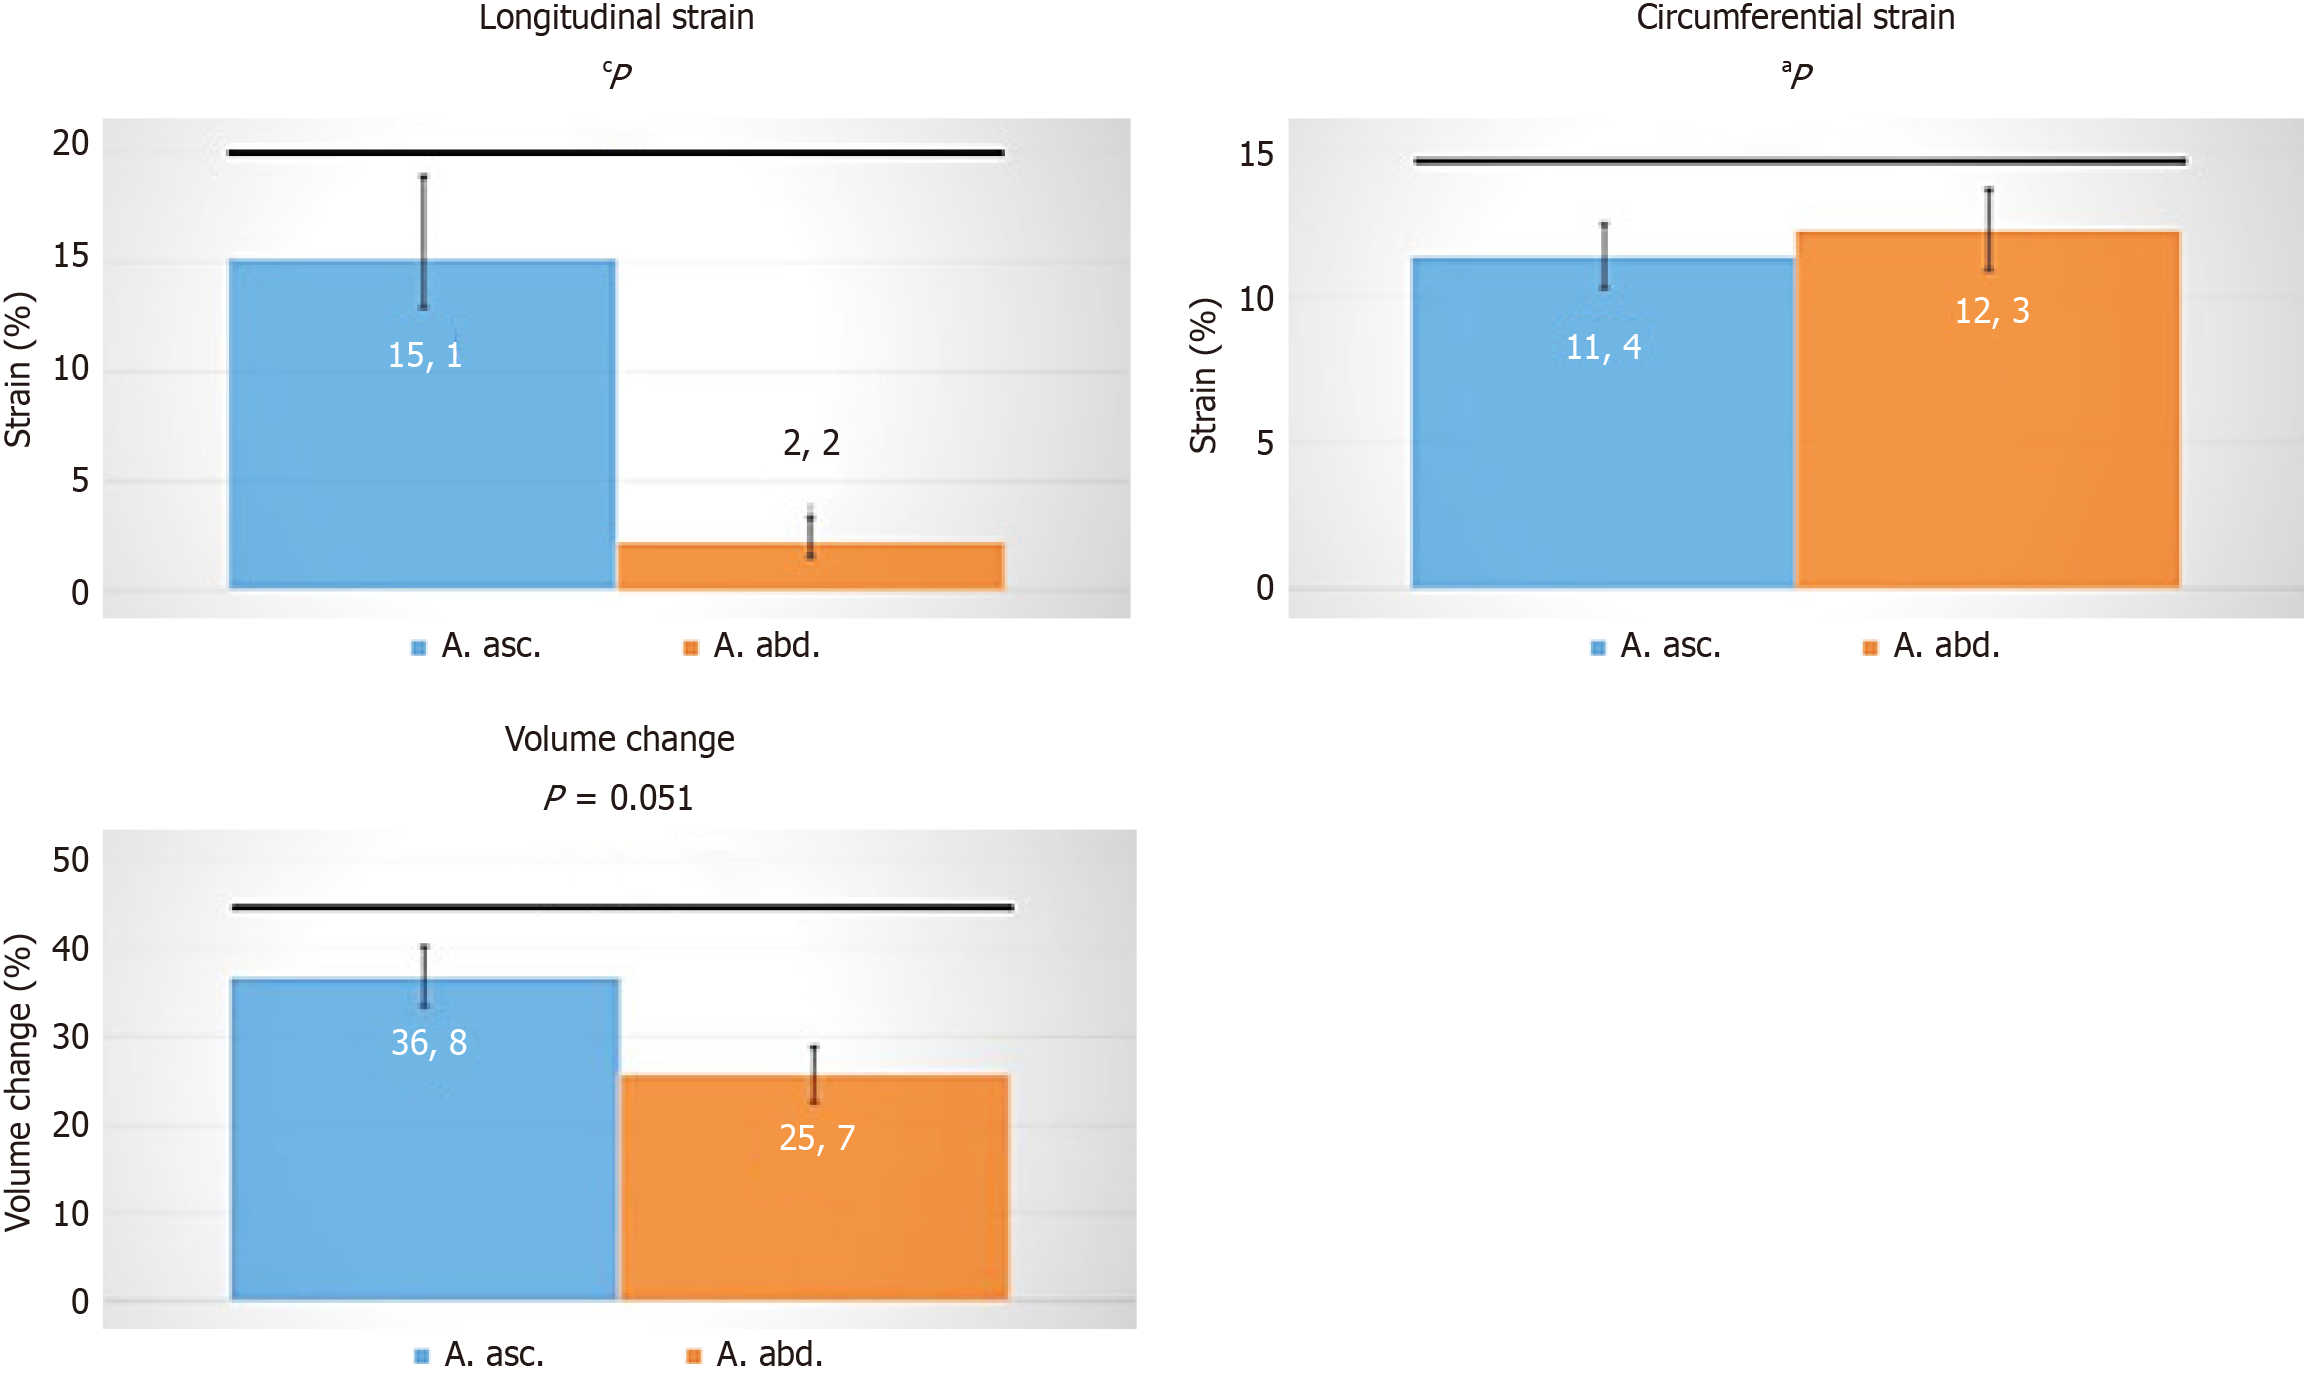
Figure 3 Differences in strain between the ascending (blue) and descending (orange) aortic root, representing varying volume charges.
Statistical analysis was performed using Wolfram MATHEMATICA 9. Data were tested for normal distribution with the function Distribution Fit test. Normal distribution was rejected for P < 0.05. For normally distributed data, values are presented as mean ± SEM, and an unpaired two-tailed t-test was conducted. For non-normally distributed data, values are given as median, and a Mann-Whitney U-test was performed. aP < 0.01; cP < 0.005.
- Citation: Irqsusi M, Rodepeter FR, Günther M, Kirschbaum A, Vogt S. Matrix metalloproteinases and their tissue inhibitors as indicators of aortic aneurysm and dissection development in extracellular matrix remodeling. World J Exp Med 2025; 15(2): 100166
- URL: https://www.wjgnet.com/2220-315x/full/v15/i2/100166.htm
- DOI: https://dx.doi.org/10.5493/wjem.v15.i2.100166


