Copyright
©The Author(s) 2024.
World J Exp Med. Mar 20, 2024; 14(1): 91271
Published online Mar 20, 2024. doi: 10.5493/wjem.v14.i1.91271
Published online Mar 20, 2024. doi: 10.5493/wjem.v14.i1.91271
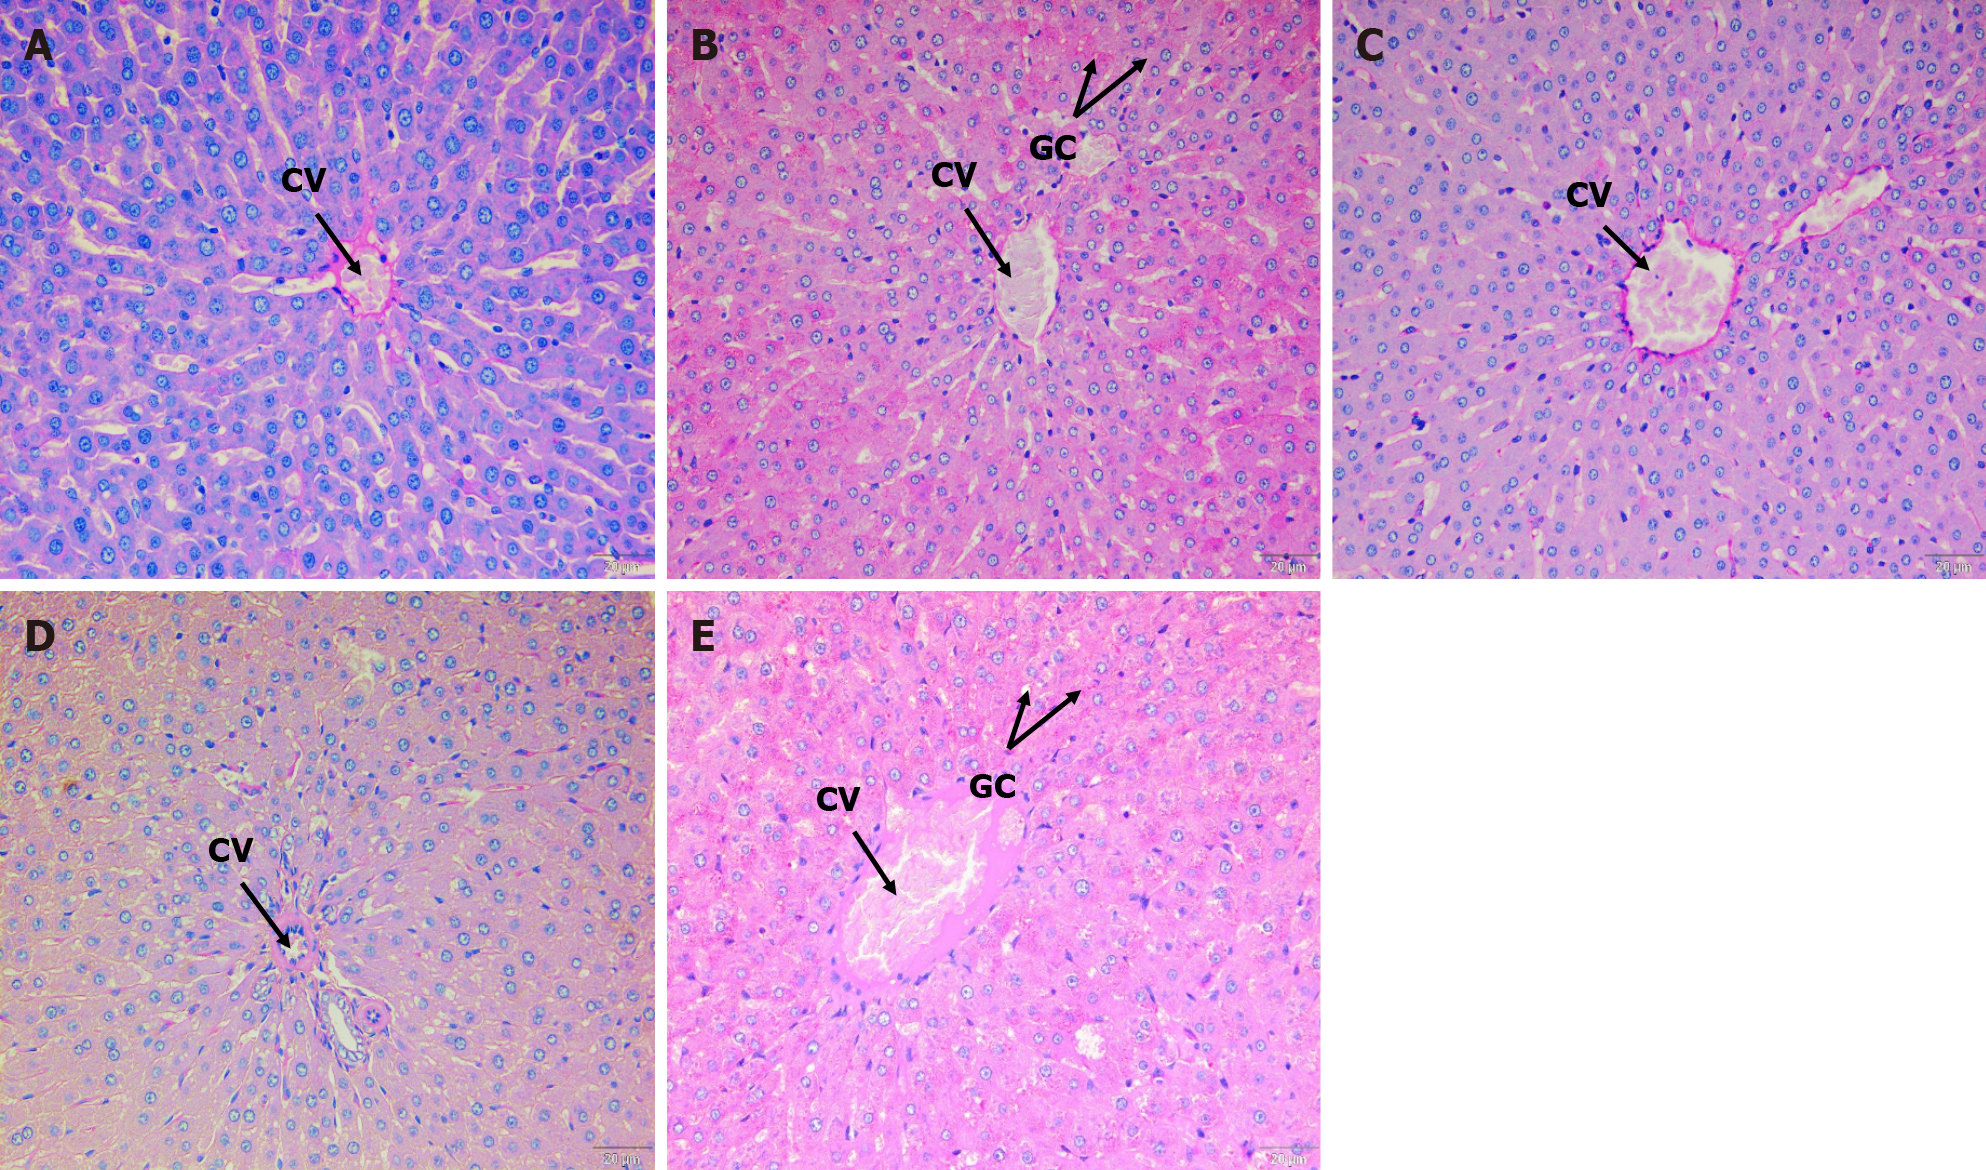
Figure 5 Periodic acid–Schiff staining of liver tissue sample on the 13th day of study.
A: Tissue sample for the non-diabetic (ND) control group; B: Untreated diabetic (UNT) group; C: Stingless bee honey (SBH) treatment group; D: Stingless bee honey plus metformin (SBME) treatment group; E: Metformin treatment (MET) group. The ND control group showed normal architecture. The UNT group showed an increase in glycogen content. The SBH diabetic group showed a reduction in glycogen content. The MET group showed an increase in glycogen content. The SBME group showed a reduction in glycogen content (PAS staining, 40 ×). CV: Central vein; GC: Glycogen content showed an increase in glycogen content.
- Citation: Mohd Nasir S, Ismail AF, Tuan Ismail TS, Wan Abdul Rahman WF, Wan Ahmad WAN, Tengku Din TADAA, Sirajudeen KNS. Hepatic and renal effects of oral stingless bee honey in a streptozotocin-induced diabetic rat model. World J Exp Med 2024; 14(1): 91271
- URL: https://www.wjgnet.com/2220-315x/full/v14/i1/91271.htm
- DOI: https://dx.doi.org/10.5493/wjem.v14.i1.91271


