Copyright
©2013 Baishideng.
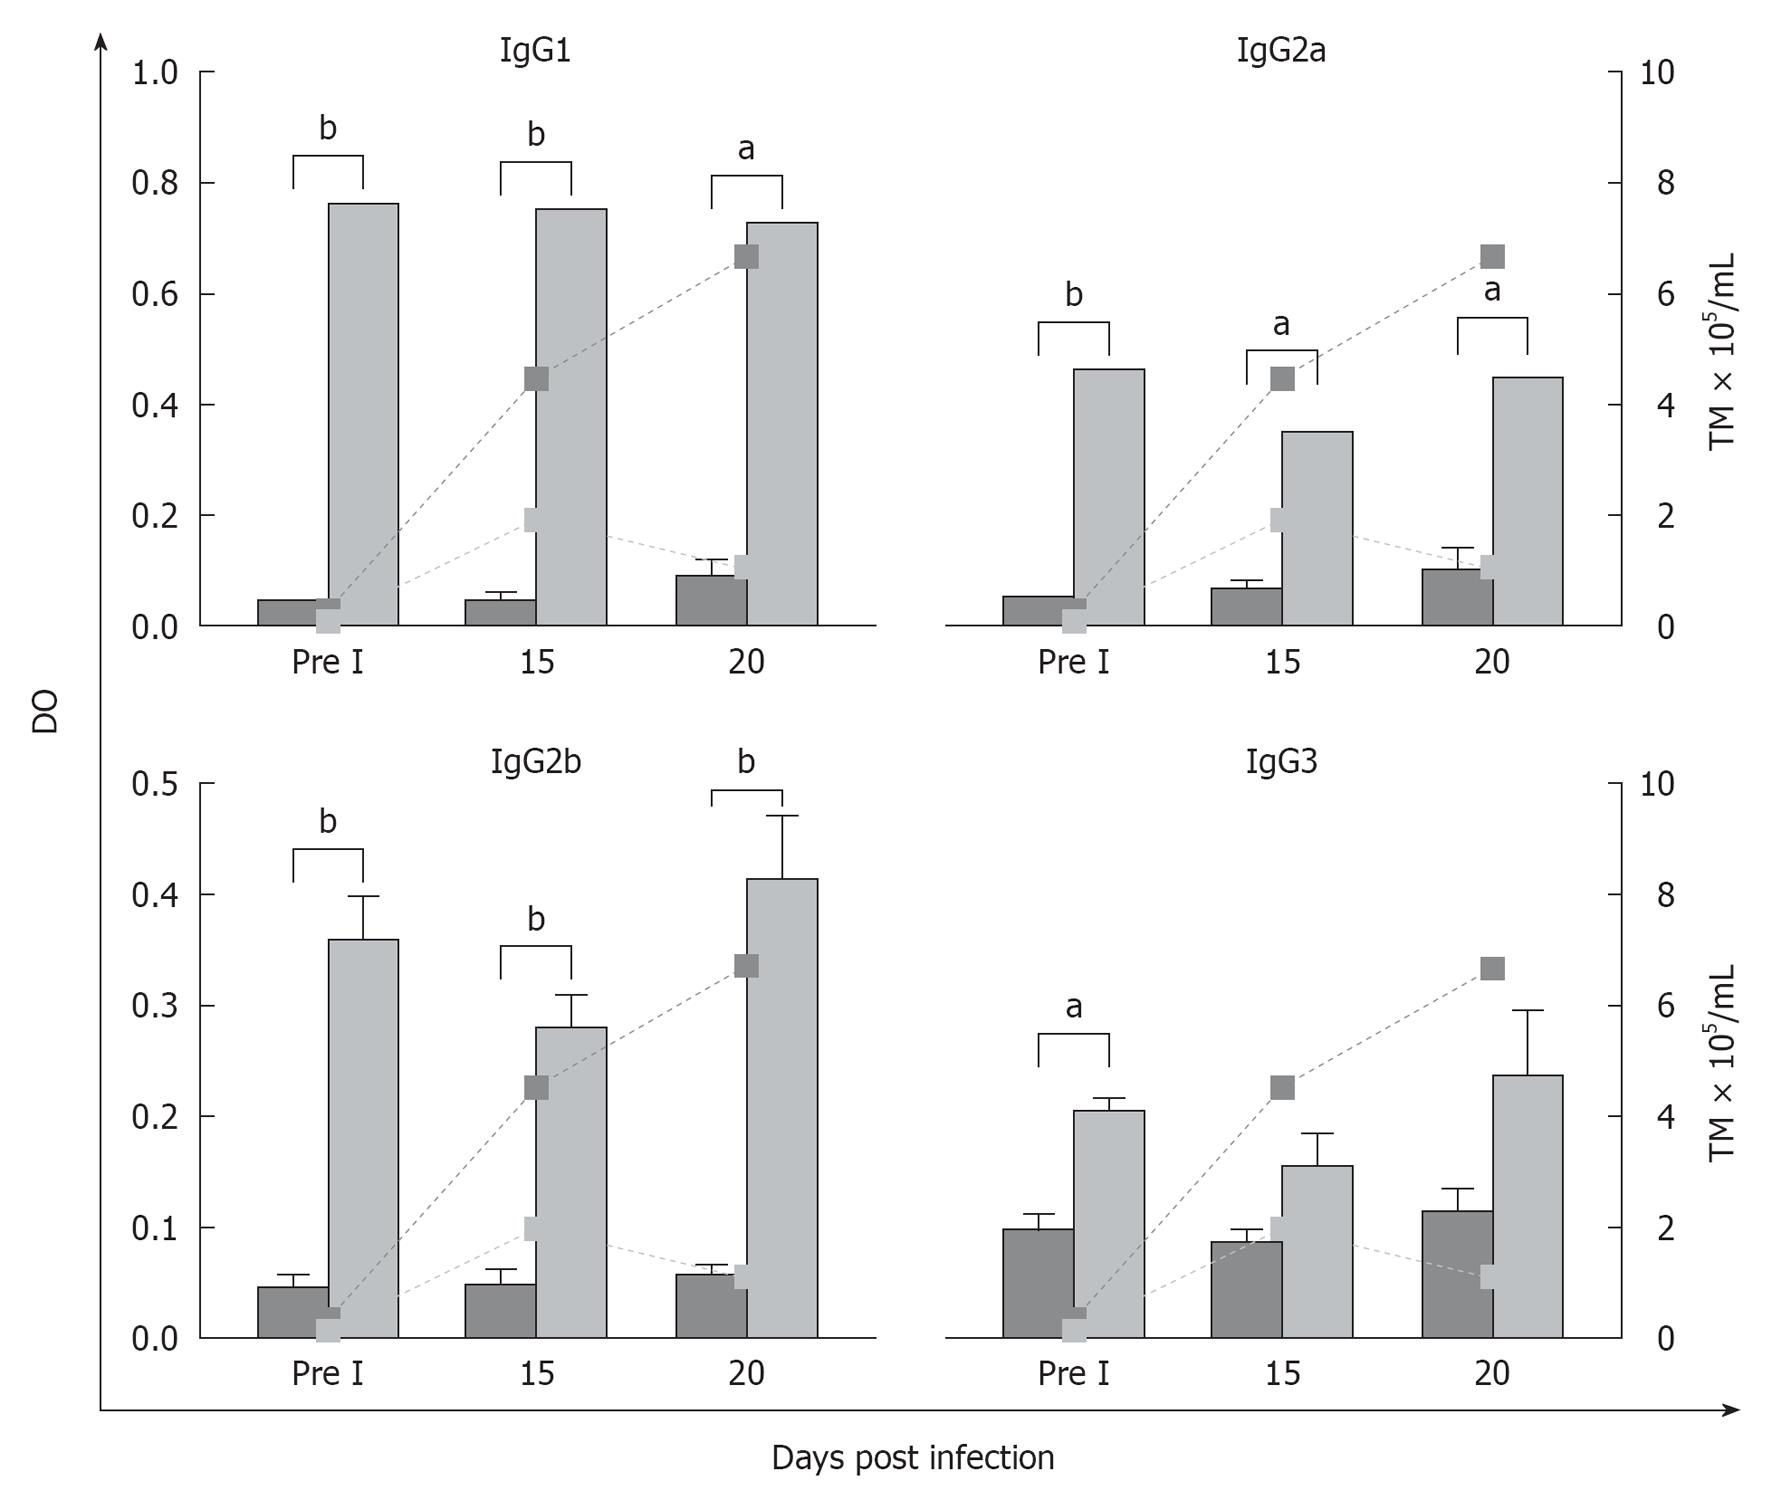
Figure 4 Specific IgG isotype levels in peritoneal fluid obtained from vaccinated, (light gray bars) or control mice, (dark gray bars) before and after infection determined by enzyme-linked immunosorbent assay (optical density mean ± SE).
The doted line is the parasitemia level at different time of infection. Significant differences between both groups evaluated by Student’s t-test (aP < 0.05, bP < 0.001).
- Citation: Basso B. Modulation of immune response in experimental Chagas disease. World J Exp Med 2013; 3(1): 1-10
- URL: https://www.wjgnet.com/2220-315X/full/v3/i1/1.htm
- DOI: https://dx.doi.org/10.5493/wjem.v3.i1.1


