Copyright
©2013 Baishideng.
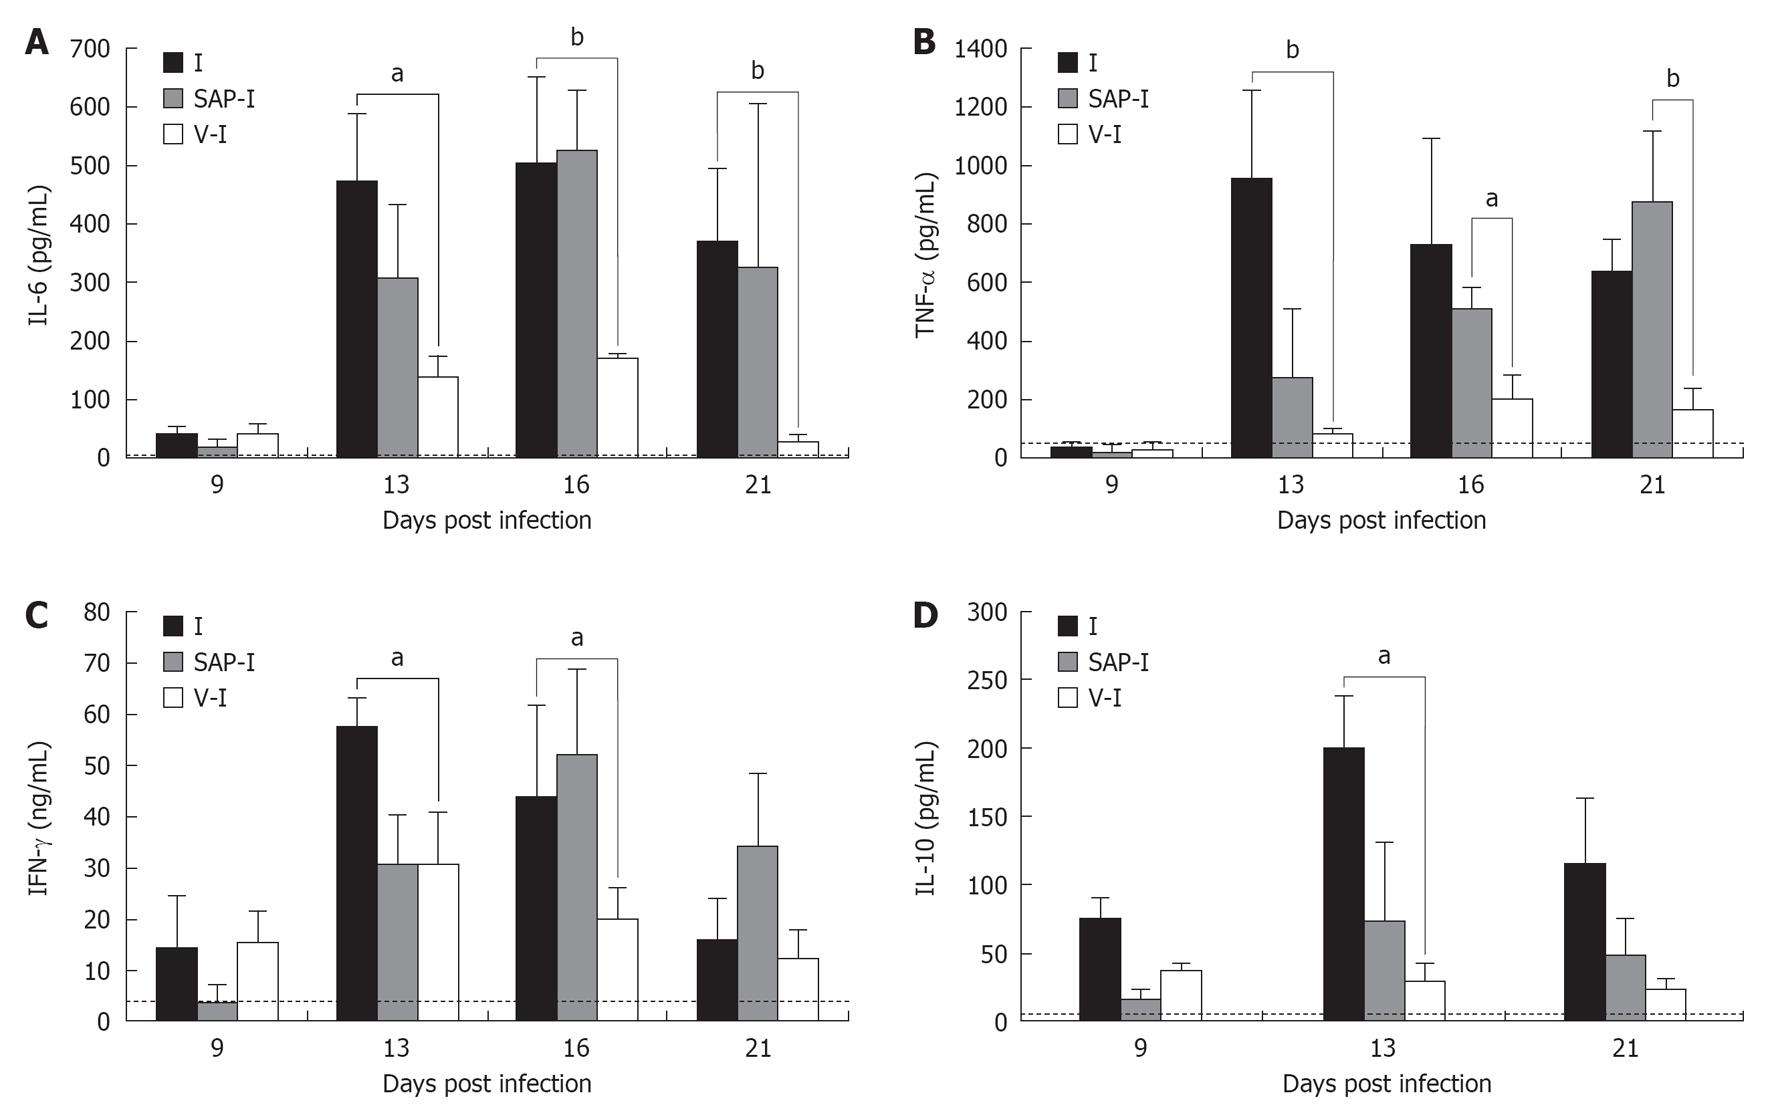
Figure 3 Kinetic of circulating cytokine levels in mice infected with Trypanosoma cruzi (A), in mice treated with saponin adjuvant and infected and in mice vaccinated with Trypanosoma cruzi and after infected (A-D).
mean ± SE cytokine are represented. The area below the pointed line indicates the 95% confidence limit of each cytokine observed in plasma from uninfected mice. A: Interleukin (IL)-6; B: Tumor necrosis factor (TNF)-α; C: Interferon (IFN)-γ; D: IL-10. The differences in cytokine levels among I and SAP-I groups with respect to V-I group were evaluated by t-test: aP < 0.05, bP < 0.01.
- Citation: Basso B. Modulation of immune response in experimental Chagas disease. World J Exp Med 2013; 3(1): 1-10
- URL: https://www.wjgnet.com/2220-315X/full/v3/i1/1.htm
- DOI: https://dx.doi.org/10.5493/wjem.v3.i1.1


