Copyright
©The Author(s) 2019.
World J Crit Care Med. Nov 19, 2019; 8(7): 106-119
Published online Nov 19, 2019. doi: 10.5492/wjccm.v8.i7.106
Published online Nov 19, 2019. doi: 10.5492/wjccm.v8.i7.106
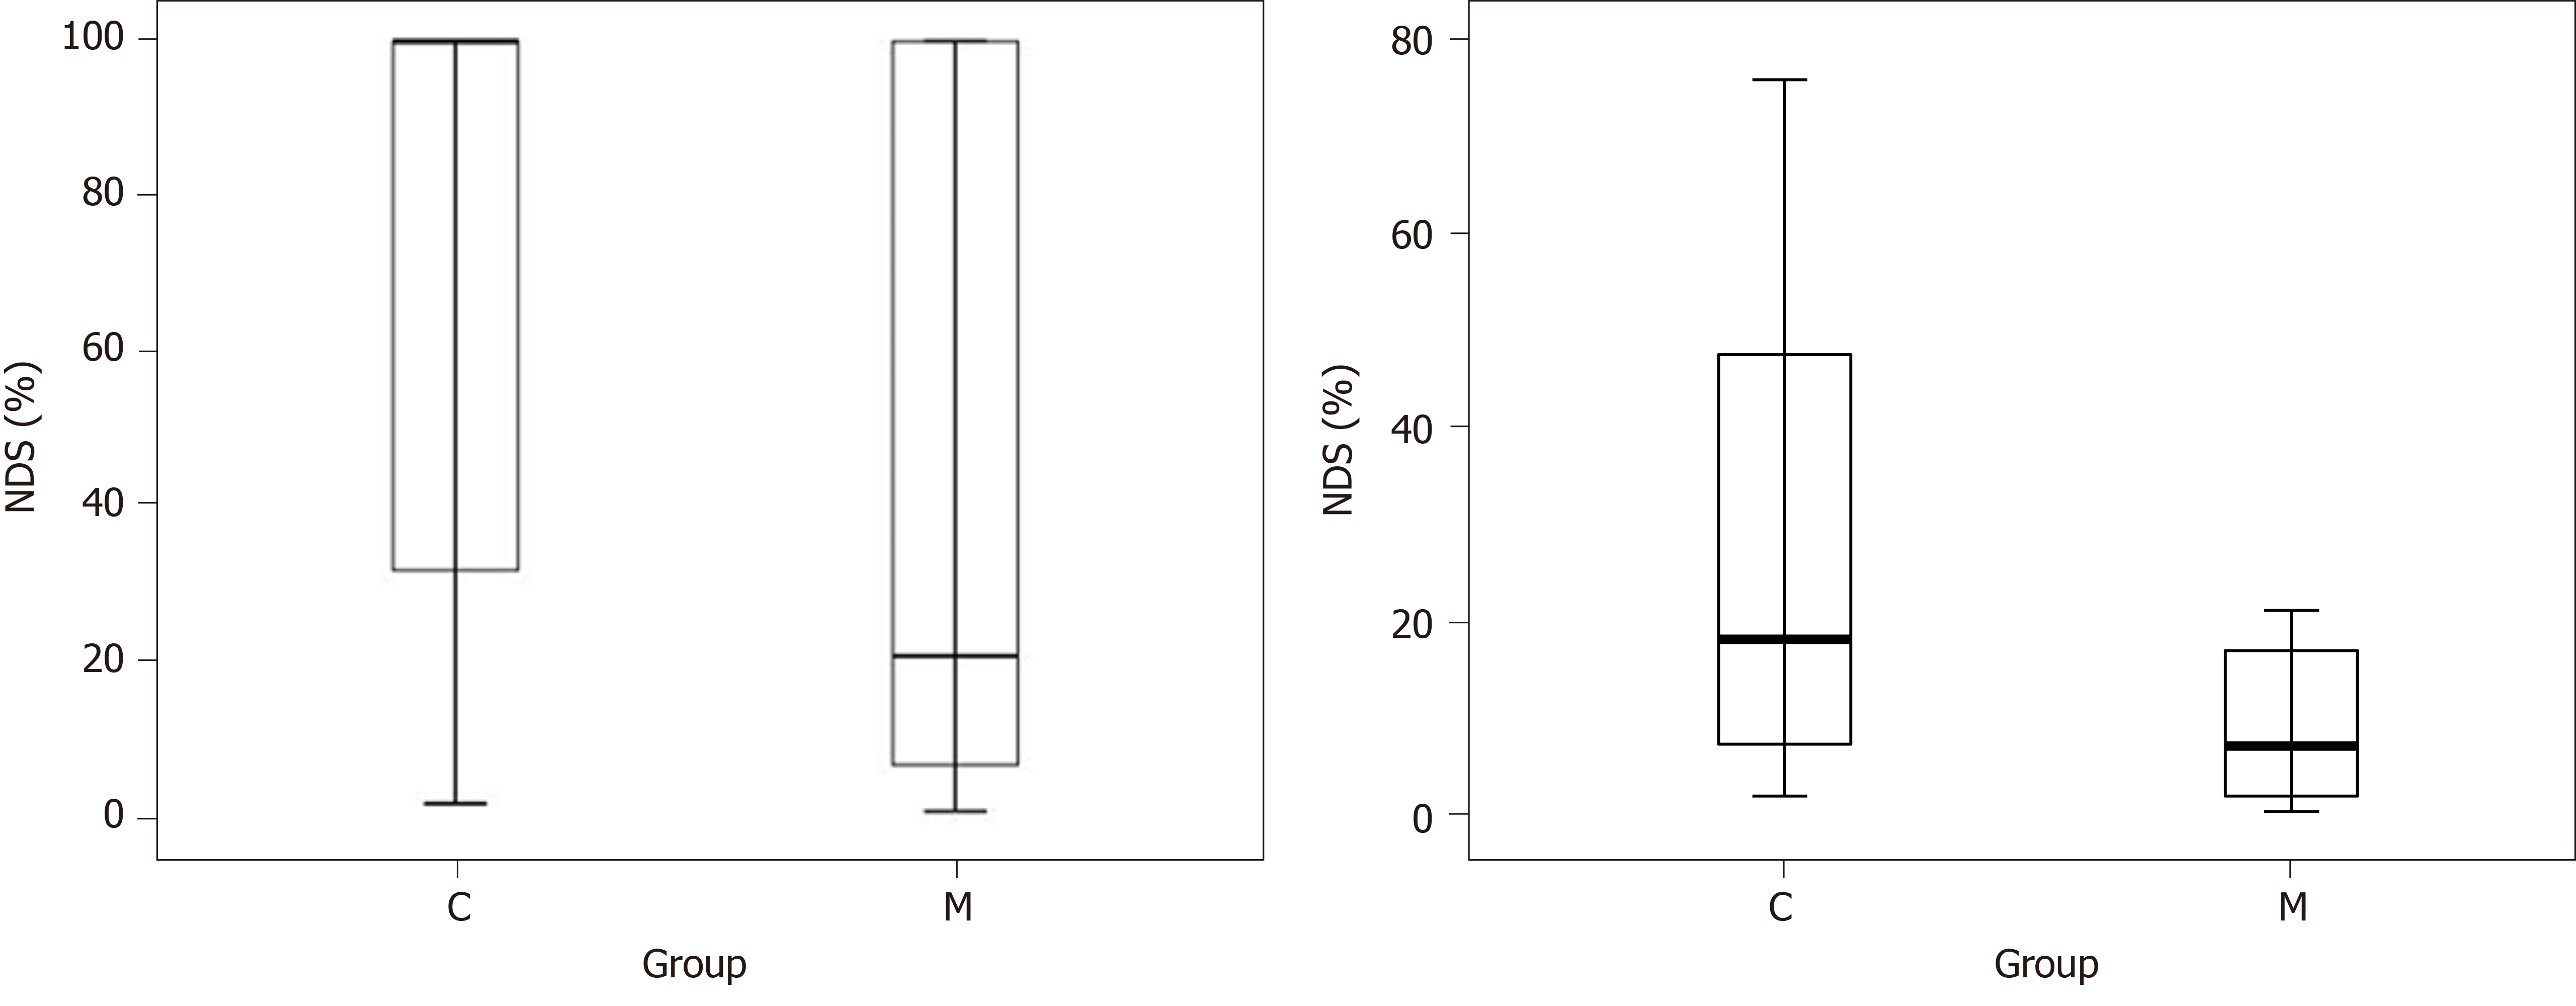
Figure 3 Neurologic deficit score at 72 h in all rats studied (left panel) and in survivors only (right panel).
Boxes represent interquartile ranges. The line across each box indicates the median, and the whiskers are the highest and lowest values. No differences between groups. C: Control group; M: Minocycline group; NDS: Neurologic deficit score.
- Citation: Janata A, Magnet IA, Schreiber KL, Wilson CD, Stezoski JP, Janesko-Feldman K, Kochanek PM, Drabek T. Minocycline fails to improve neurologic and histologic outcome after ventricular fibrillation cardiac arrest in rats. World J Crit Care Med 2019; 8(7): 106-119
- URL: https://www.wjgnet.com/2220-3141/full/v8/i7/106.htm
- DOI: https://dx.doi.org/10.5492/wjccm.v8.i7.106


