Copyright
©The Author(s) 2018.
World J Crit Care Med. Aug 4, 2018; 7(3): 39-45
Published online Aug 4, 2018. doi: 10.5492/wjccm.v7.i3.39
Published online Aug 4, 2018. doi: 10.5492/wjccm.v7.i3.39
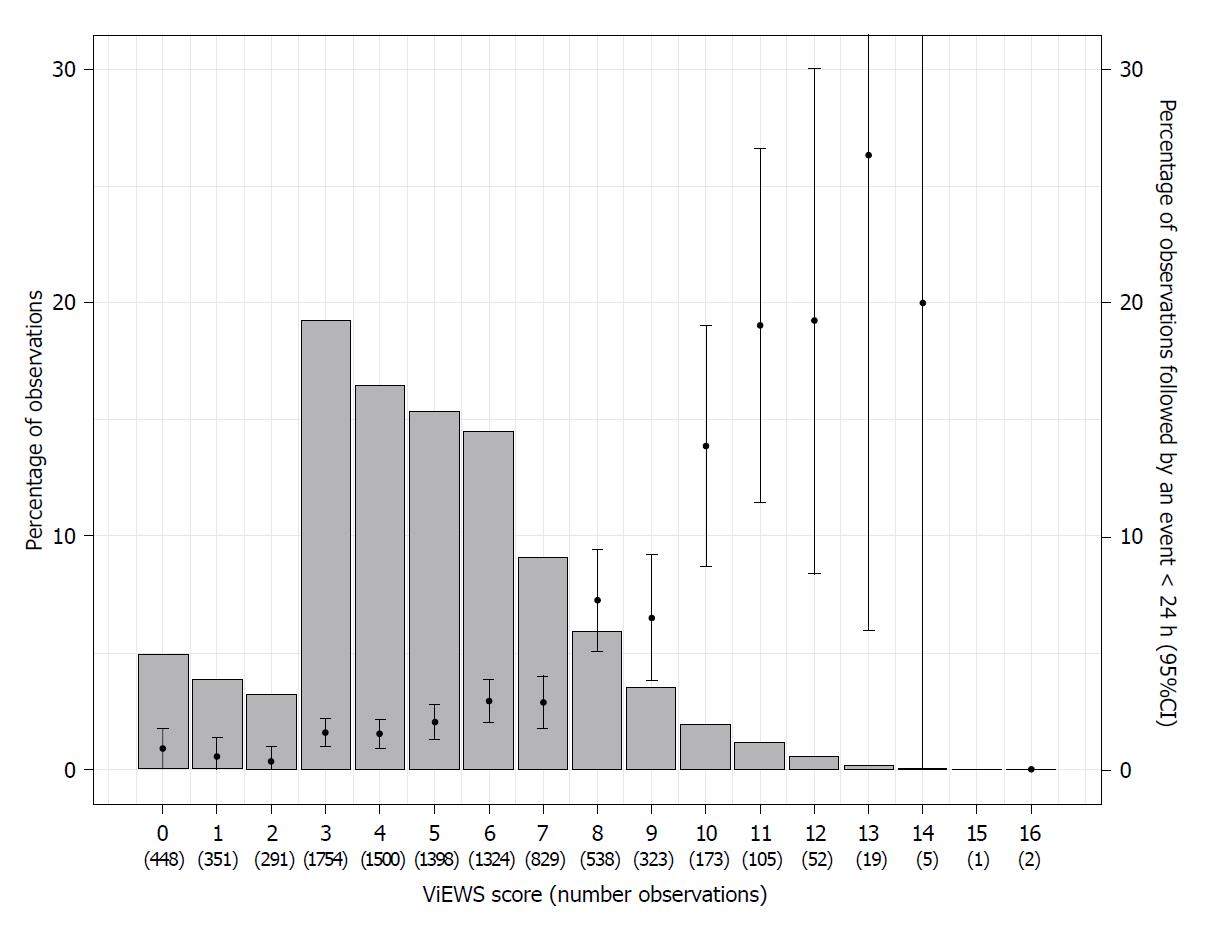
Figure 2 Distribution of VitalPAC Early Warning Score and transfer to the Intensive Care Unit rates.
This figure shows distribution of the VitalPAC Early Warning Score aggregated values (bar chart) in relation with the occurrence of the event (ICU transfer or mortality within 24 h), with 95%CIs. ICU: Intensive Care Unit.
- Citation: Plate JD, Peelen LM, Leenen LP, Hietbrink F. Validation of the VitalPAC Early Warning Score at the Intermediate Care Unit. World J Crit Care Med 2018; 7(3): 39-45
- URL: https://www.wjgnet.com/2220-3141/full/v7/i3/39.htm
- DOI: https://dx.doi.org/10.5492/wjccm.v7.i3.39


