Copyright
©The Author(s) 2017.
World J Crit Care Med. Feb 4, 2017; 6(1): 65-73
Published online Feb 4, 2017. doi: 10.5492/wjccm.v6.i1.65
Published online Feb 4, 2017. doi: 10.5492/wjccm.v6.i1.65
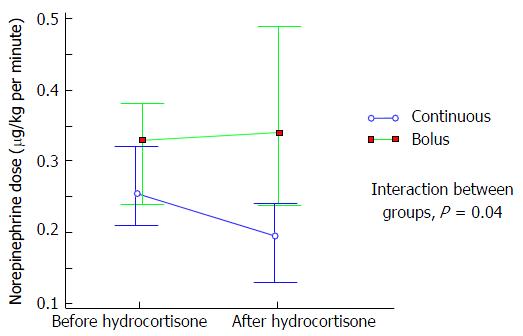
Figure 1 Change in maximal norepinephrine dose from 12 h after initiation of hydrocortisone.
Comparison between continuous and bolus administration groups, with two-way mixed ANOVA test, P = 0.04.
- Citation: Ibarra-Estrada MA, Chávez-Peña Q, Reynoso-Estrella CI, Rios-Zermeño J, Aguilera-González PE, García-Soto MA, Aguirre-Avalos G. Timing, method and discontinuation of hydrocortisone administration for septic shock patients. World J Crit Care Med 2017; 6(1): 65-73
- URL: https://www.wjgnet.com/2220-3141/full/v6/i1/65.htm
- DOI: https://dx.doi.org/10.5492/wjccm.v6.i1.65


