Copyright
©The Author(s) 2016.
World J Crit Care Med. Feb 4, 2016; 5(1): 17-26
Published online Feb 4, 2016. doi: 10.5492/wjccm.v5.i1.17
Published online Feb 4, 2016. doi: 10.5492/wjccm.v5.i1.17
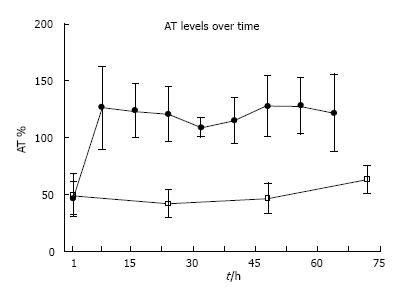
Figure 2 A 72 h depiction of q 8 h dosage coefficient of variations for the antithrombin-treated burn patients (black dots) compared to control plasma antithrombin levels (white squares) (personal file AKV).
AT: Antithrombin.
- Citation: Kowal-Vern A, Orkin BA. Antithrombin in the treatment of burn trauma. World J Crit Care Med 2016; 5(1): 17-26
- URL: https://www.wjgnet.com/2220-3141/full/v5/i1/17.htm
- DOI: https://dx.doi.org/10.5492/wjccm.v5.i1.17


