Copyright
©2014 Baishideng Publishing Group Co.
World J Crit Care Med. May 4, 2014; 3(2): 55-60
Published online May 4, 2014. doi: 10.5492/wjccm.v3.i2.55
Published online May 4, 2014. doi: 10.5492/wjccm.v3.i2.55
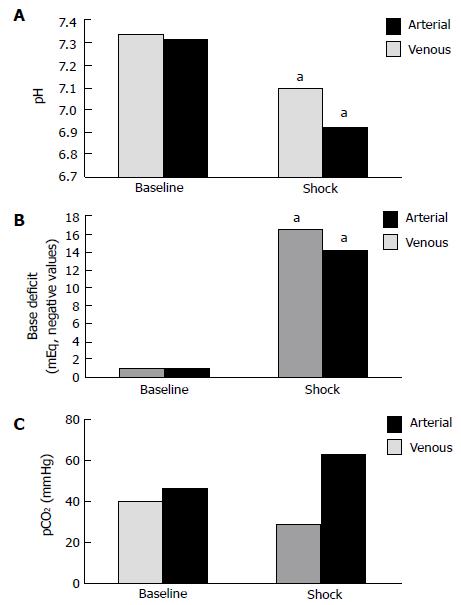
Figure 1 Arterial and venous blood gas at baseline and shock states.
aP < 0.05 vs control group. A: pH; B: Base deficit; C: pCO2.
-
Citation: Williams KB, Christmas AB, Heniford BT, Sing RF, Messick J. Arterial
vs venous blood gas differences during hemorrhagic shock. World J Crit Care Med 2014; 3(2): 55-60 - URL: https://www.wjgnet.com/2220-3141/full/v3/i2/55.htm
- DOI: https://dx.doi.org/10.5492/wjccm.v3.i2.55


