Copyright
©2013 Baishideng Publishing Group Co.
World J Crit Care Med. Nov 4, 2013; 2(4): 56-64
Published online Nov 4, 2013. doi: 10.5492/wjccm.v2.i4.56
Published online Nov 4, 2013. doi: 10.5492/wjccm.v2.i4.56
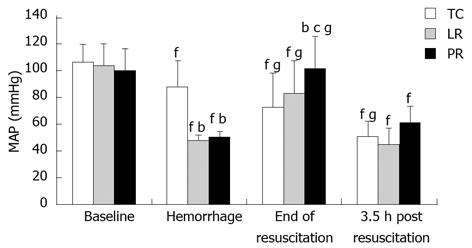
Figure 1 Systemic arterial pressure during hemorrhage, resuscitation and recovery.
Values are mean ± SD from 8 time control (TC), 9 lactate Ringer’s (LR), and 10 pyruvate Ringer’s (PR) experiments. bP < 0.01 vs TC; cP < 0.05 vs LR; fP < 0.01 vs baseline of same group; gP < 0.05 vs pre-resuscitation hemorrhage of same group.
- Citation: Gurji HA, White DW, Hoxha B, Sun J, Olivencia-Yurvati AH, Mallet RT. Pyruvate-fortified resuscitation stabilizes cardiac electrical activity and energy metabolism during hypovolemia. World J Crit Care Med 2013; 2(4): 56-64
- URL: https://www.wjgnet.com/2220-3141/full/v2/i4/56.htm
- DOI: https://dx.doi.org/10.5492/wjccm.v2.i4.56


