Copyright
©2013 Baishideng Publishing Group Co.
World J Crit Care Med. May 4, 2013; 2(2): 9-16
Published online May 4, 2013. doi: 10.5492/wjccm.v2.i2.9
Published online May 4, 2013. doi: 10.5492/wjccm.v2.i2.9
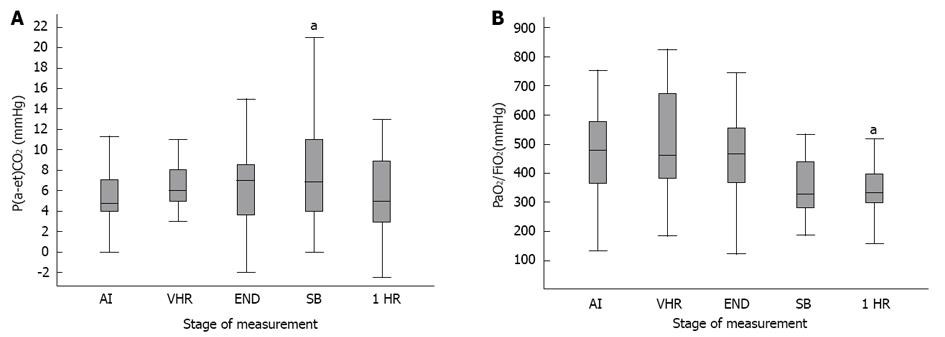
Figure 2 Changes in arterial to end-tidal CO2 gradient (A) and oxygenation index (PaO2/FiO2) (B) during and after ventral hernia repair.
aP < 0.05 vs after tracheal intubation (AI), Wilcoxon’s signed-rank test. Box plots present median, interquartile interval, and minimum-maximum. VHR: After ventral hernia repair; END: End of surgery; SB: During spontaneous breathing through the endotracheal tube; 1 HR: One hour after extubation.
- Citation: Gaidukov KM, Raibuzhis EN, Hussain A, Teterin AY, Smetkin AA, Kuzkov VV, Malbrain ML, Kirov MY. Effect of intra-abdominal pressure on respiratory function in patients undergoing ventral hernia repair. World J Crit Care Med 2013; 2(2): 9-16
- URL: https://www.wjgnet.com/2220-3141/full/v2/i2/9.htm
- DOI: https://dx.doi.org/10.5492/wjccm.v2.i2.9


