Copyright
©The Author(s) 2024.
World J Crit Care Med. Jun 9, 2024; 13(2): 93812
Published online Jun 9, 2024. doi: 10.5492/wjccm.v13.i2.93812
Published online Jun 9, 2024. doi: 10.5492/wjccm.v13.i2.93812
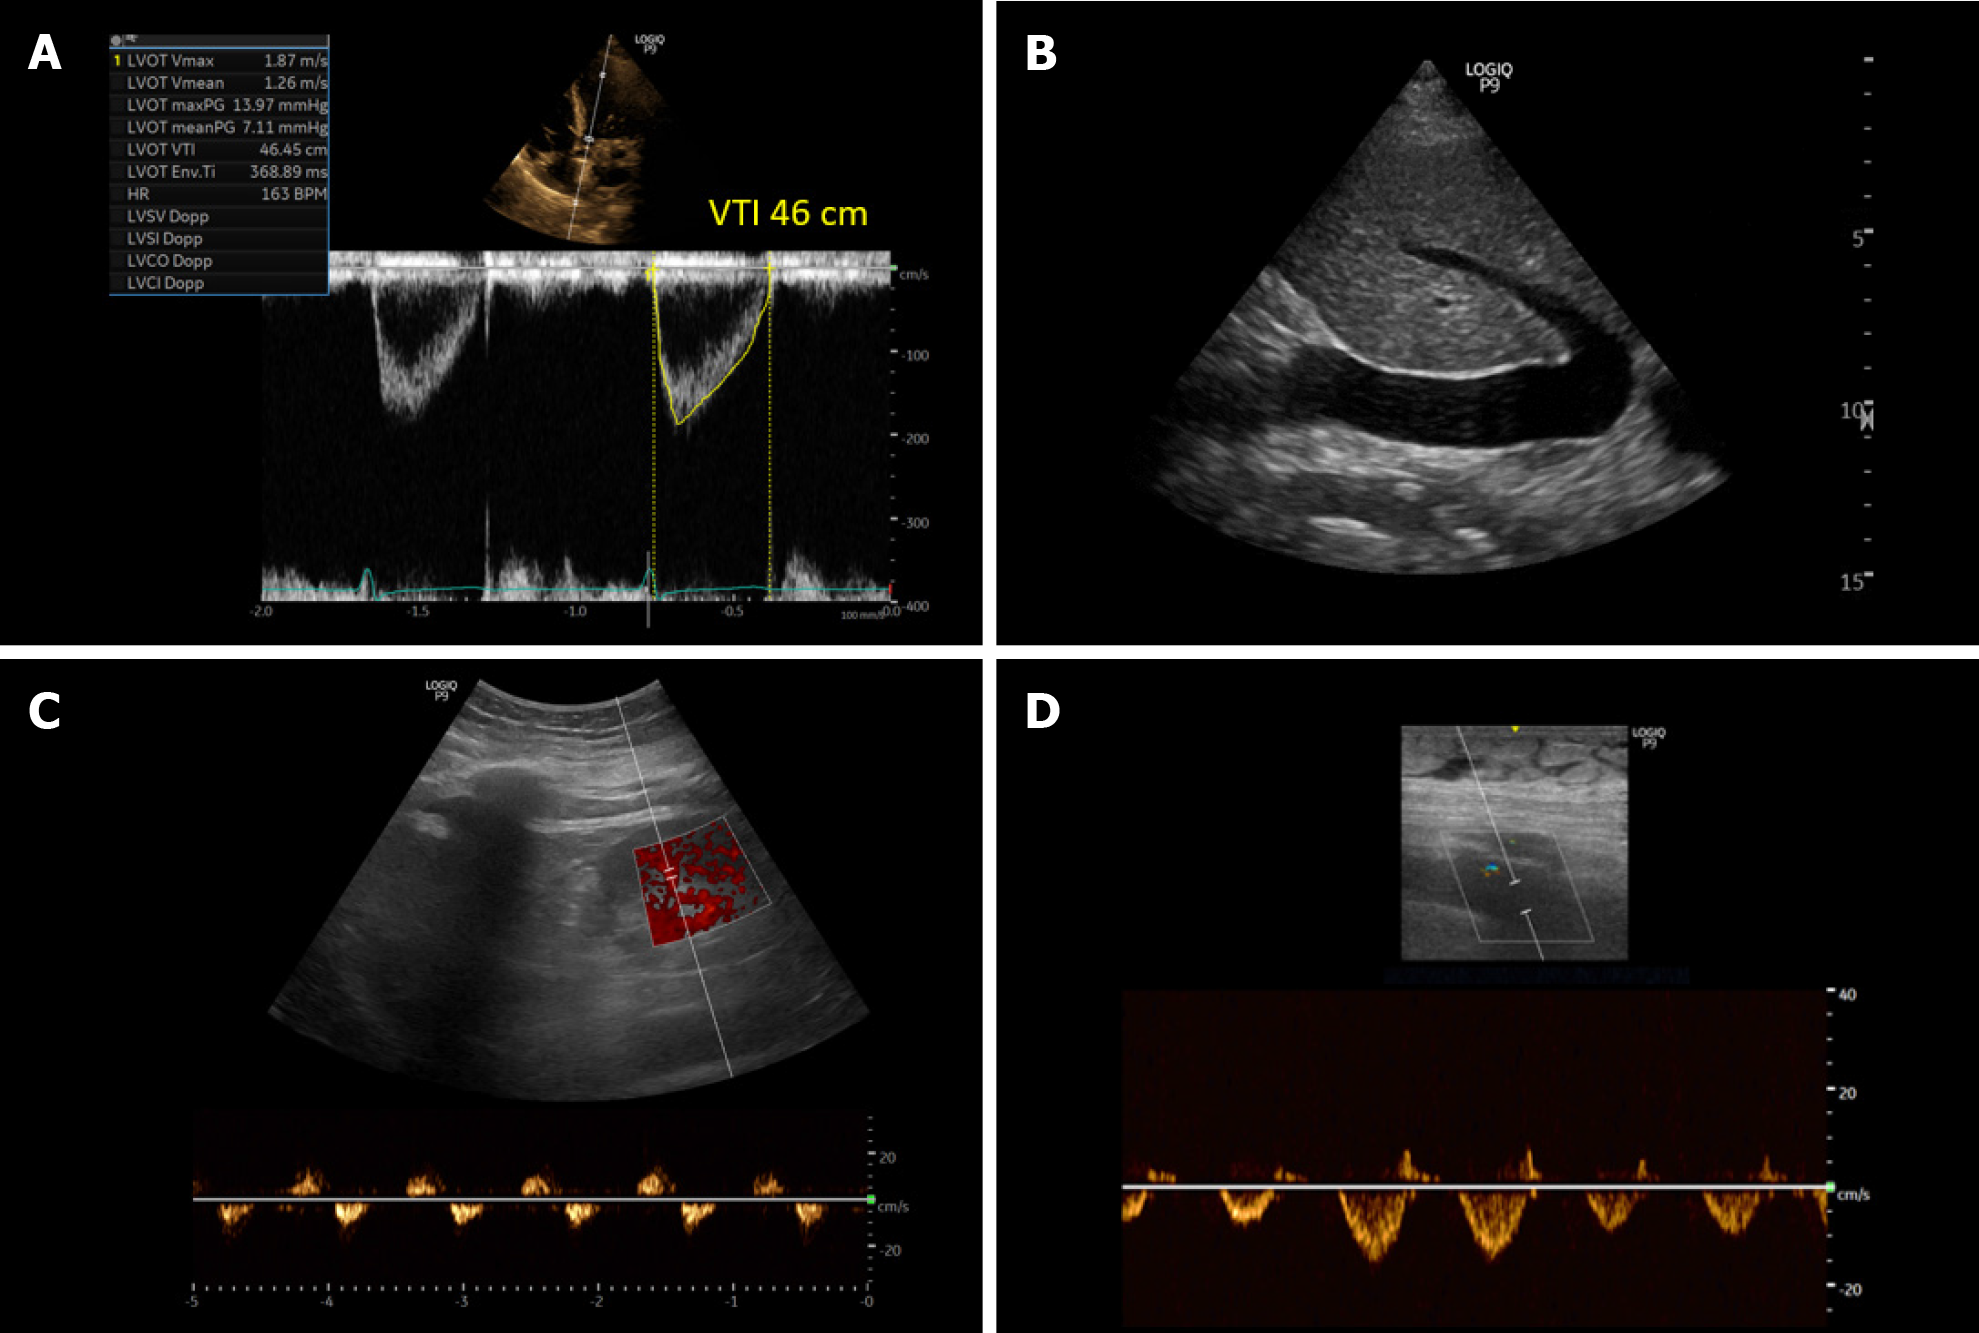
Figure 10 Ultrasound images obtained from a patient with cirrhosis and fluid overload demonstrating.
A: An elevated left ventricular outflow tract velocity time integral signifying very high stroke volume (high cardiac output); B: A plethoric inferior vena cava suggestive of elevated right atrial pressure; C and D: Significantly pulsatile renal parenchymal vein and femoral vein Doppler with flow interruptions.
- Citation: Koratala A. Point-of-care ultrasonography in cirrhosis-related acute kidney injury: How I do it. World J Crit Care Med 2024; 13(2): 93812
- URL: https://www.wjgnet.com/2220-3141/full/v13/i2/93812.htm
- DOI: https://dx.doi.org/10.5492/wjccm.v13.i2.93812


