Copyright
©The Author(s) 2024.
World J Crit Care Med. Jun 9, 2024; 13(2): 93812
Published online Jun 9, 2024. doi: 10.5492/wjccm.v13.i2.93812
Published online Jun 9, 2024. doi: 10.5492/wjccm.v13.i2.93812
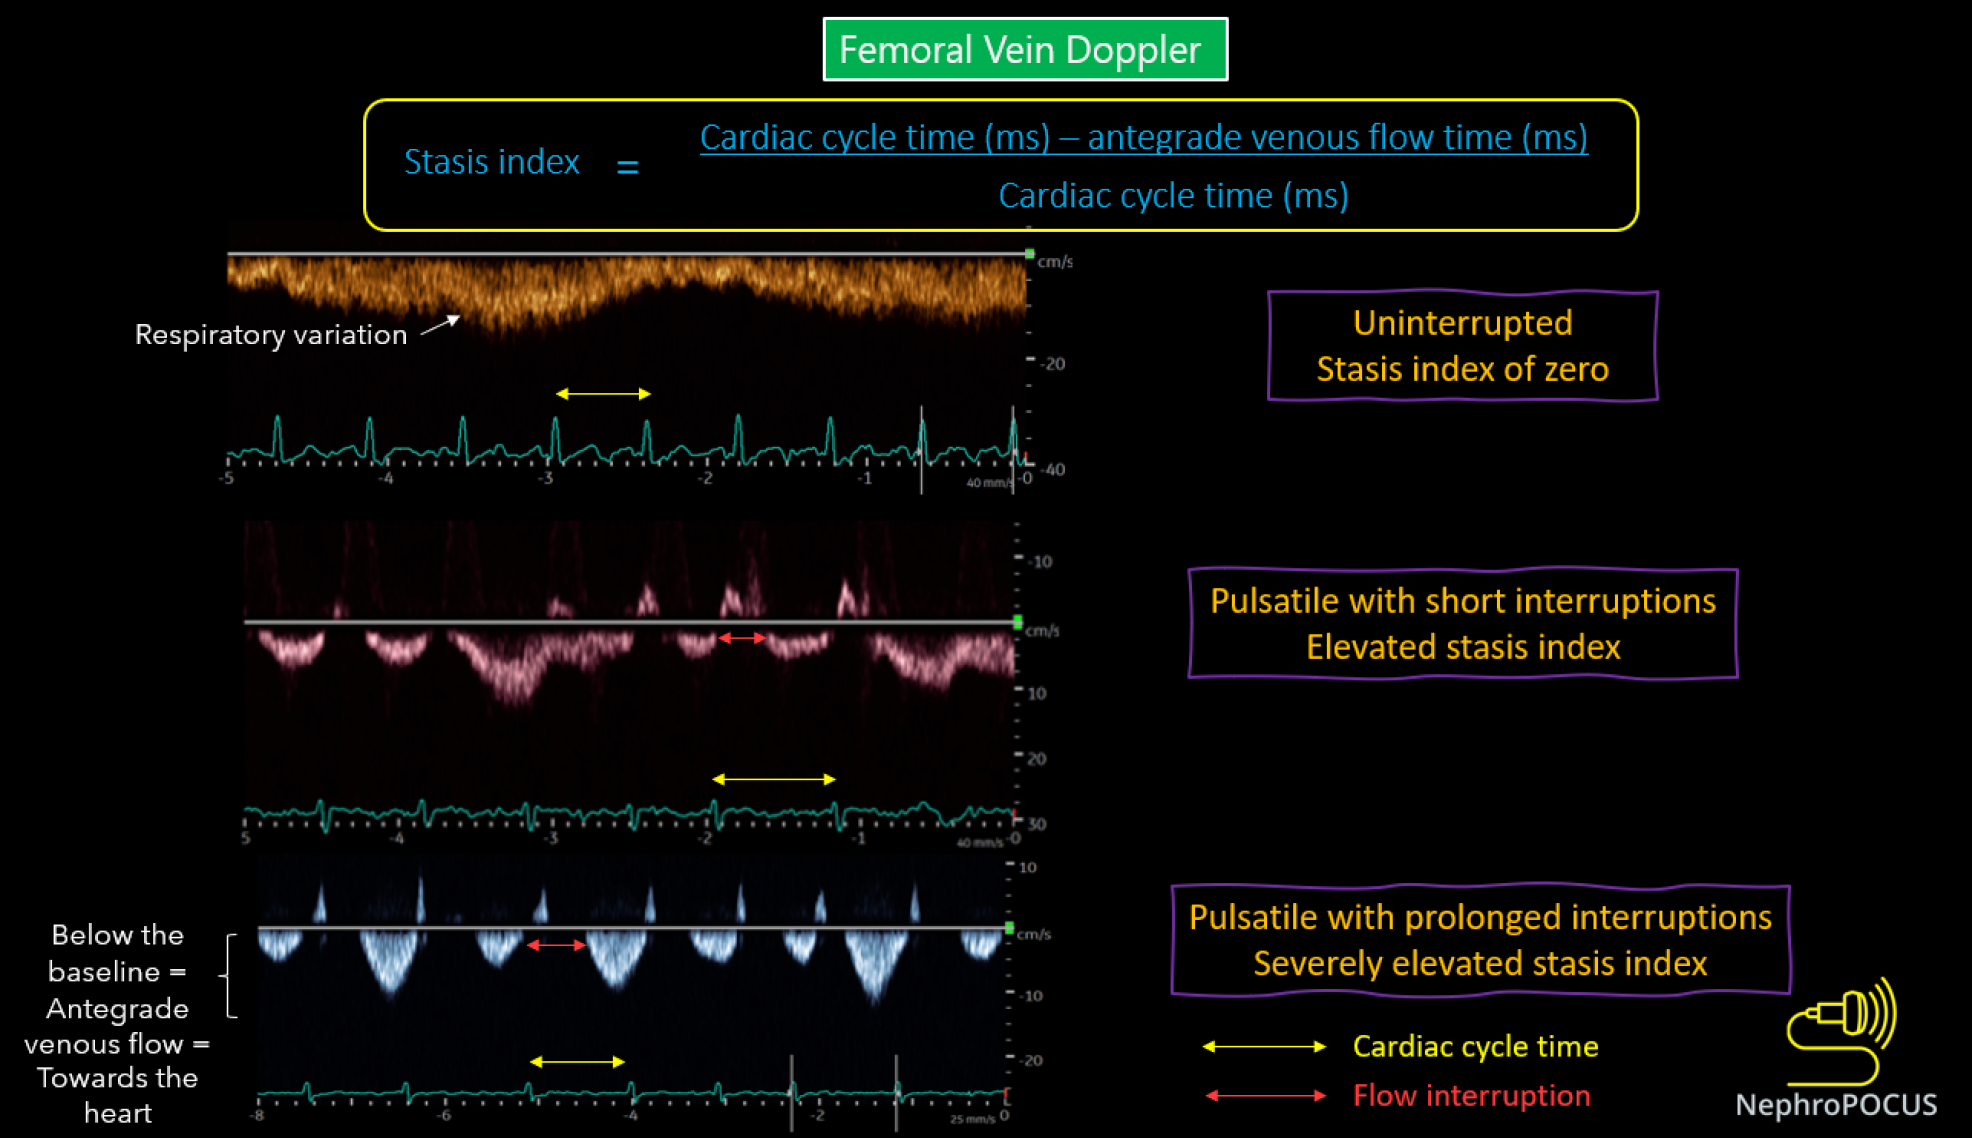
Figure 9 Changes in femoral vein Doppler correlate with escalating congestion.
In normal state, the waveform appears continuous or minimally pulsatile, with dips aligning with atrial contraction at the end of each diastole. With worsening congestion, the duration of flow interruptions rises within each cardiac cycle (indicated by an increased stasis index). Employing simultaneous electrocardiogram tracing aids in accurately identifying the duration of the cardiac cycle. Reused from NephroPOCUS.com with permission (https://nephropocus.com/about/).
- Citation: Koratala A. Point-of-care ultrasonography in cirrhosis-related acute kidney injury: How I do it. World J Crit Care Med 2024; 13(2): 93812
- URL: https://www.wjgnet.com/2220-3141/full/v13/i2/93812.htm
- DOI: https://dx.doi.org/10.5492/wjccm.v13.i2.93812


