Copyright
©The Author(s) 2022.
World J Crit Care Med. Sep 9, 2022; 11(5): 317-329
Published online Sep 9, 2022. doi: 10.5492/wjccm.v11.i5.317
Published online Sep 9, 2022. doi: 10.5492/wjccm.v11.i5.317
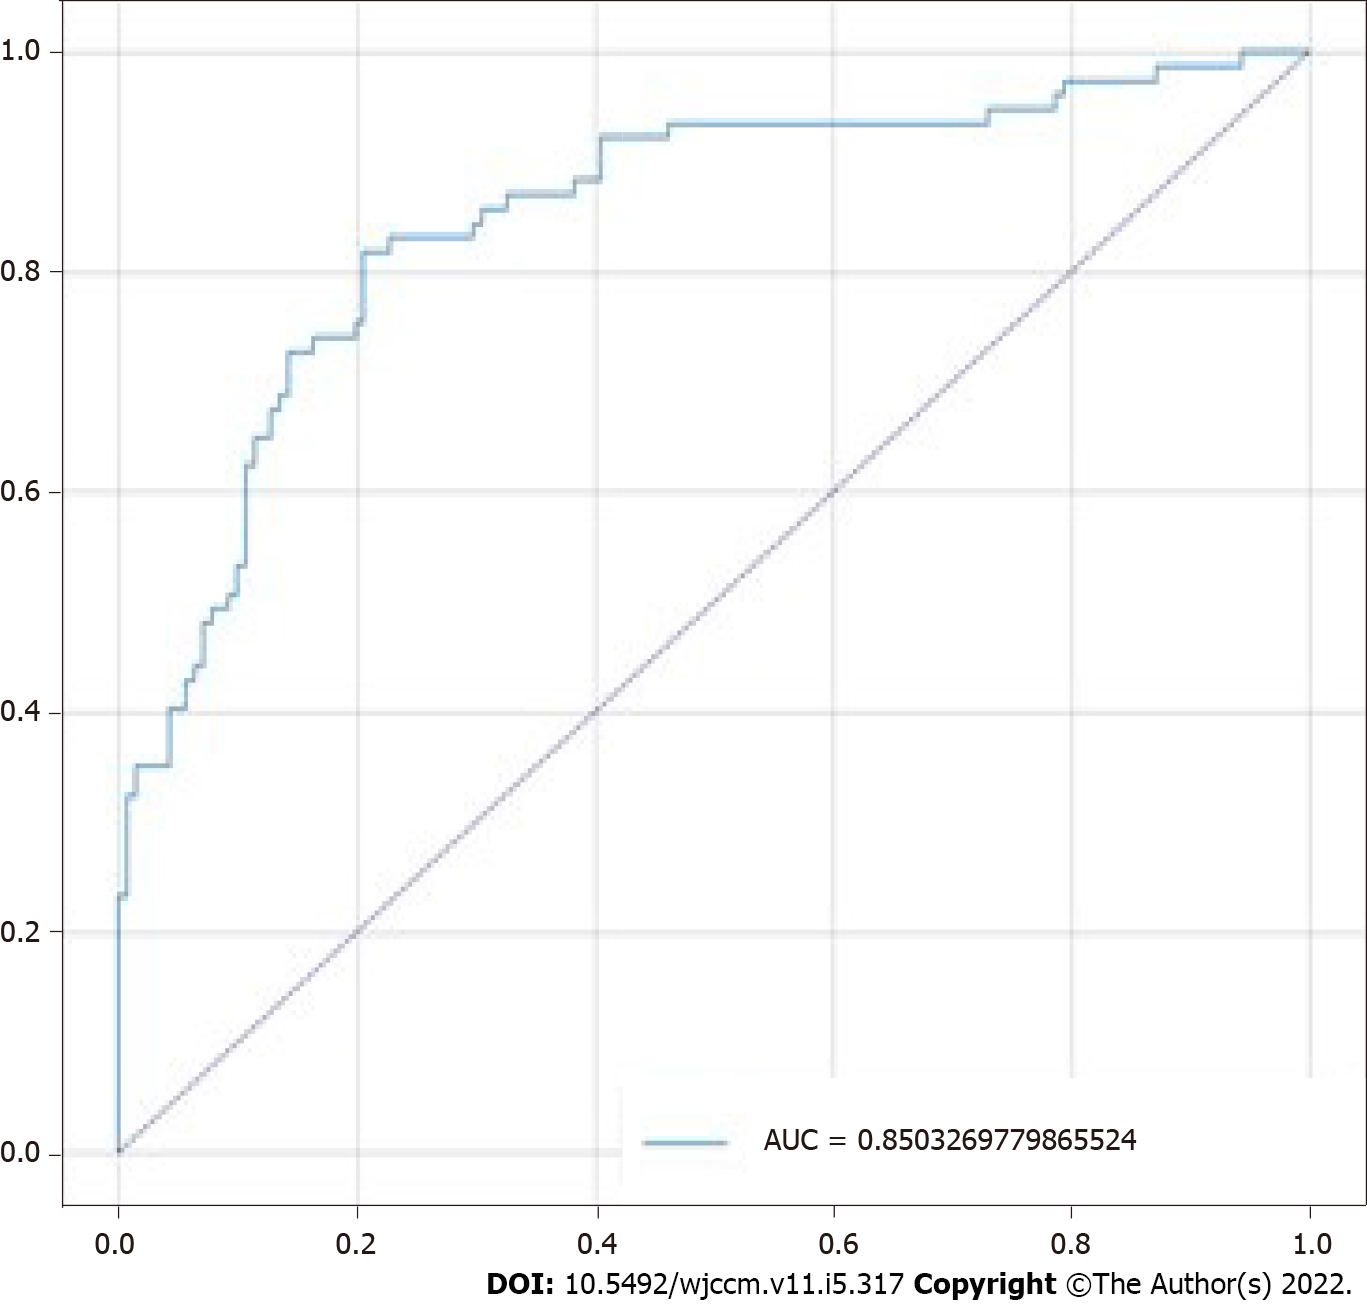
Figure 3 Model receiver operating characteristic curve.
The graph demonstrates the relationship between true and false positive rates, which led to an area under the curve of 85%. AUC: Area under the curve.
- Citation: Caires Silveira E, Mattos Pretti S, Santos BA, Santos Corrêa CF, Madureira Silva L, Freire de Melo F. Prediction of hospital mortality in intensive care unit patients from clinical and laboratory data: A machine learning approach. World J Crit Care Med 2022; 11(5): 317-329
- URL: https://www.wjgnet.com/2220-3141/full/v11/i5/317.htm
- DOI: https://dx.doi.org/10.5492/wjccm.v11.i5.317


