Copyright
©The Author(s) 2021.
World J Crit Care Med. Nov 9, 2021; 10(6): 310-322
Published online Nov 9, 2021. doi: 10.5492/wjccm.v10.i6.310
Published online Nov 9, 2021. doi: 10.5492/wjccm.v10.i6.310
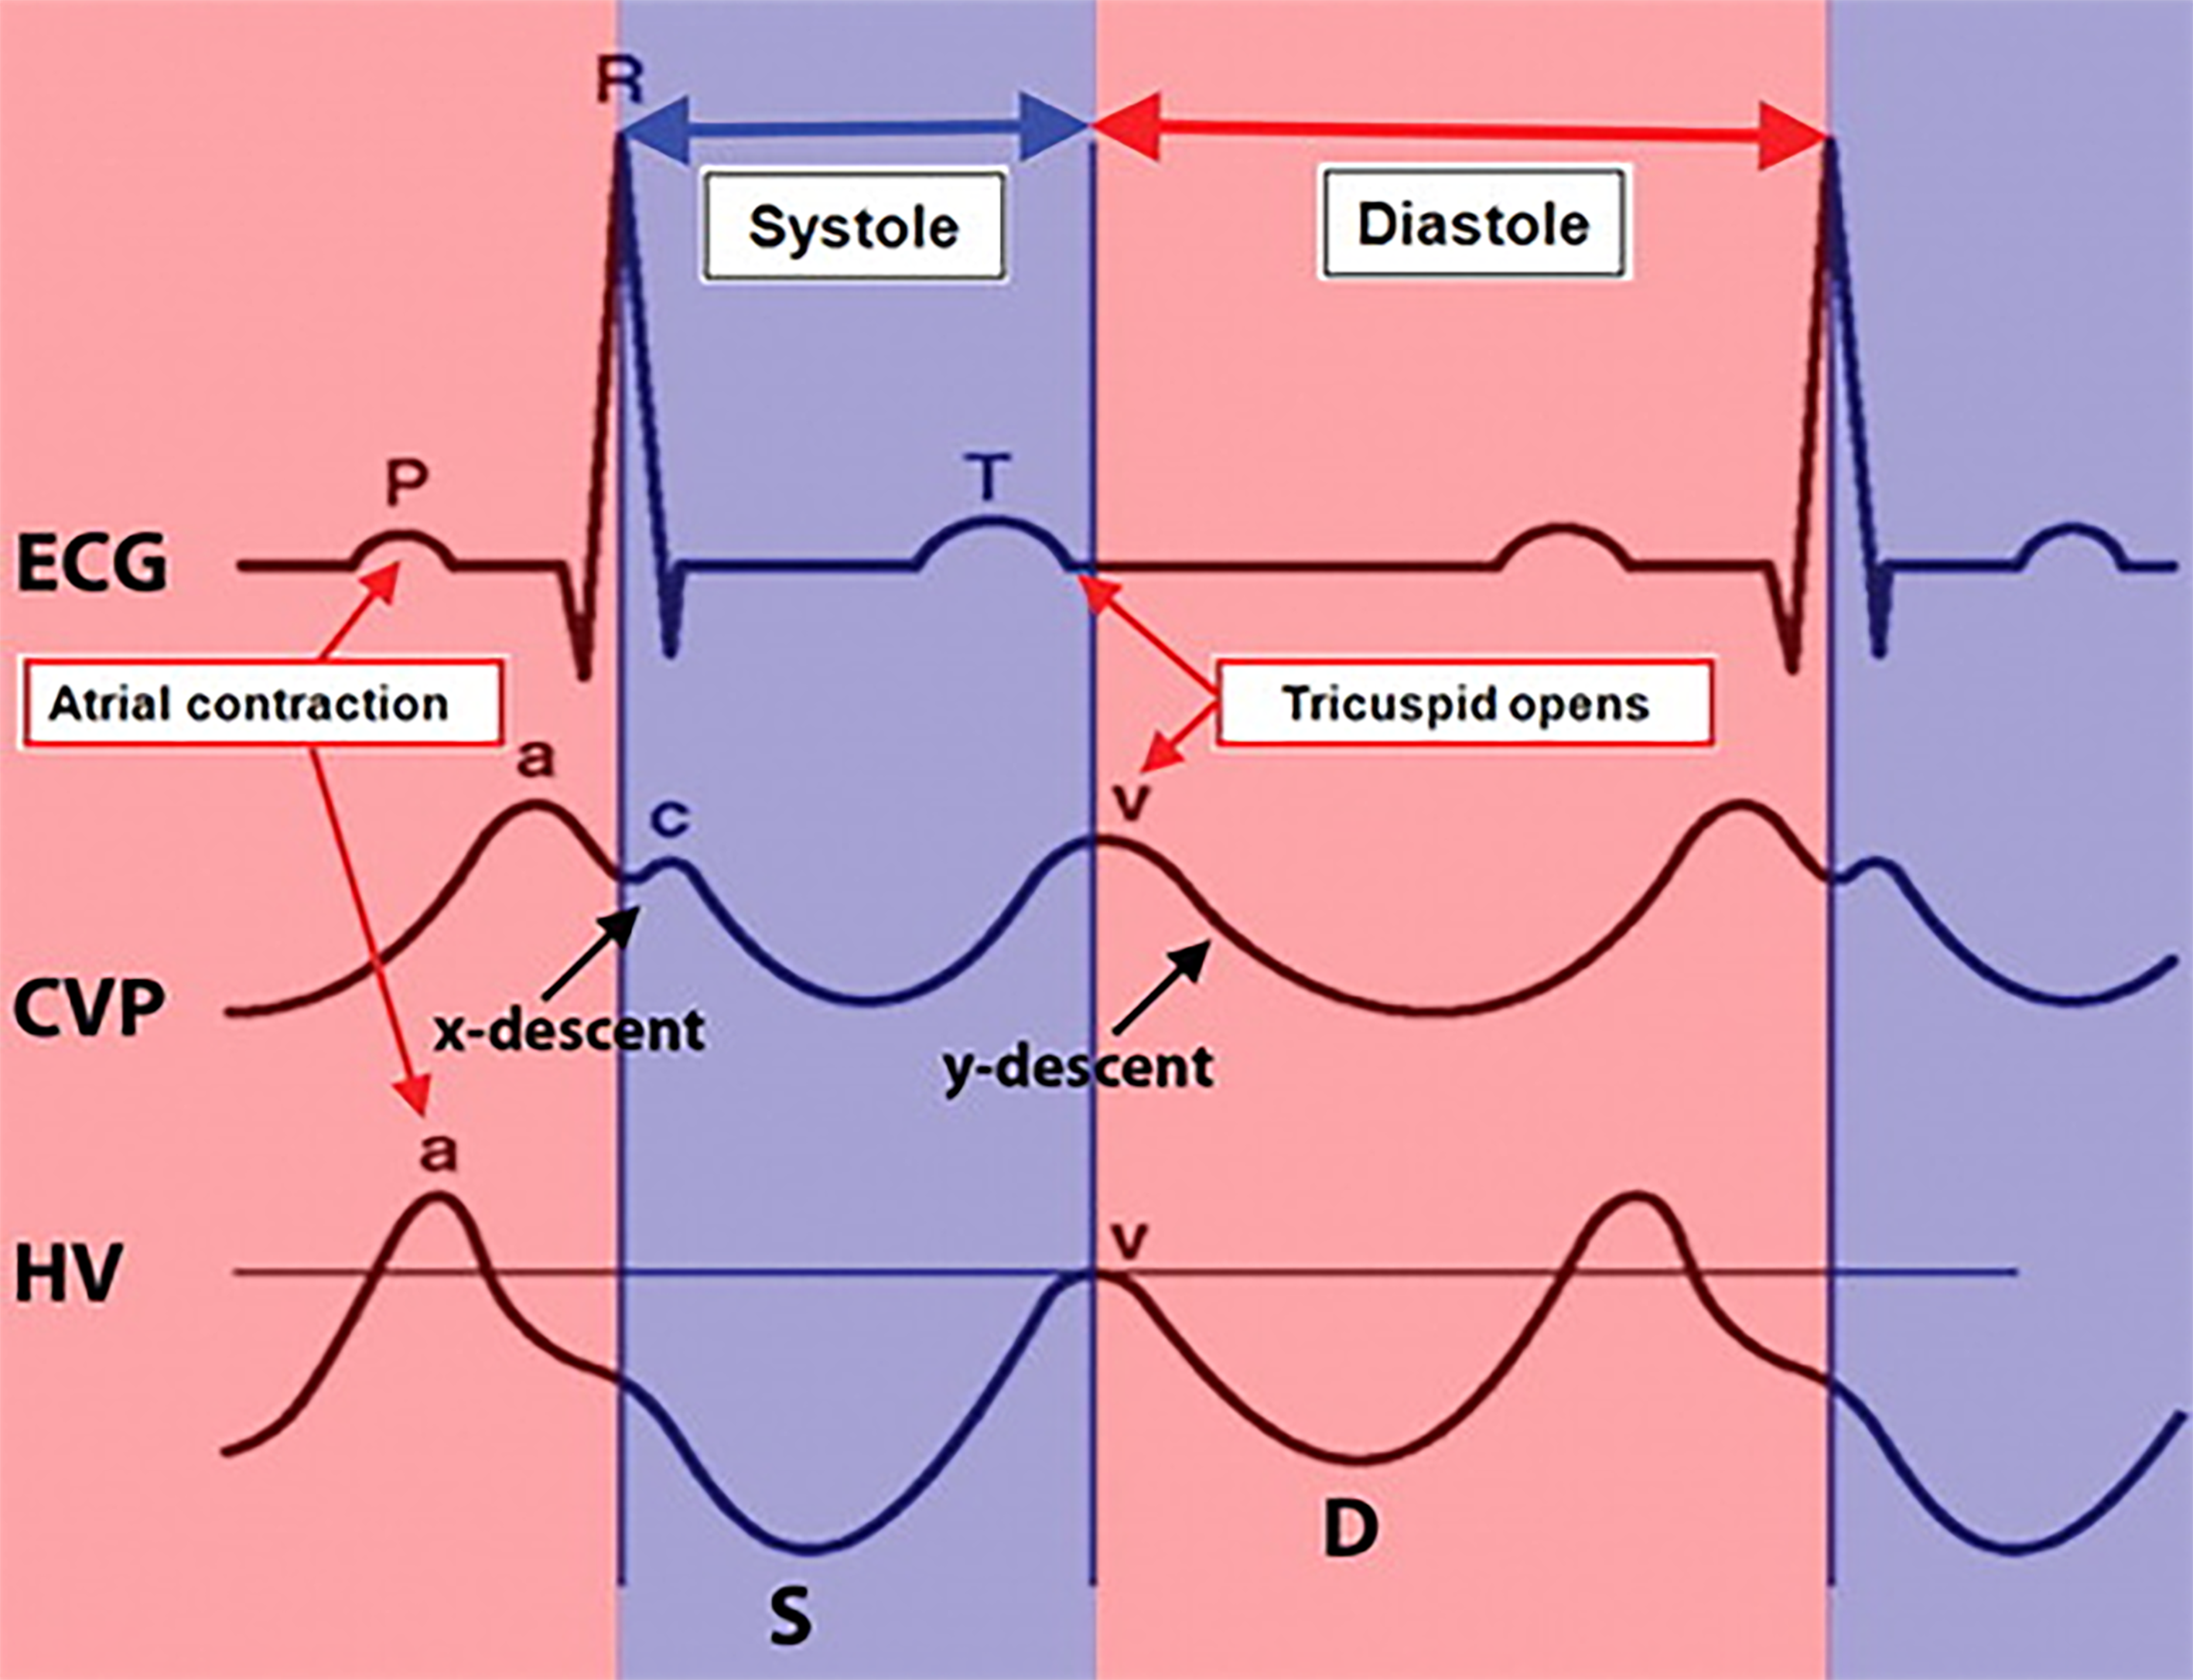
Figure 1 Normal time-correlated electrocardiographic findings, central venous pressure tracing, and hepatic venous waveform.
The peak of the retrograde a wave corresponds with atrial contraction, which occurs at end diastole. The trough of the antegrade S wave correlates with peak negative pressure created by the downward motion of the atrioventricular septum during early to mid-systole. The peak of the upward-facing v wave correlates with opening of the tricuspid valve, which marks the transition from systole to diastole. The peak of this wave may cross above the baseline (retrograde flow) or may stay below the baseline (i.e., remain antegrade). The trough of the antegrade D wave correlates with rapid early diastolic right ventricular filling. ECG: Electrocardiographic; CVP: Central venous pressure; HV: Hepatic venous. Citation: McNaughton DA, Abu-Yousef MM. Doppler US of the liver made simple. Radiographics 2011; 31: 161-188. Copyright © The Authors 2020. Published by Radiological Society of North America (RSNA®).
- Citation: Galindo P, Gasca C, Argaiz ER, Koratala A. Point of care venous Doppler ultrasound: Exploring the missing piece of bedside hemodynamic assessment. World J Crit Care Med 2021; 10(6): 310-322
- URL: https://www.wjgnet.com/2220-3141/full/v10/i6/310.htm
- DOI: https://dx.doi.org/10.5492/wjccm.v10.i6.310


