Copyright
©The Author(s) 2016.
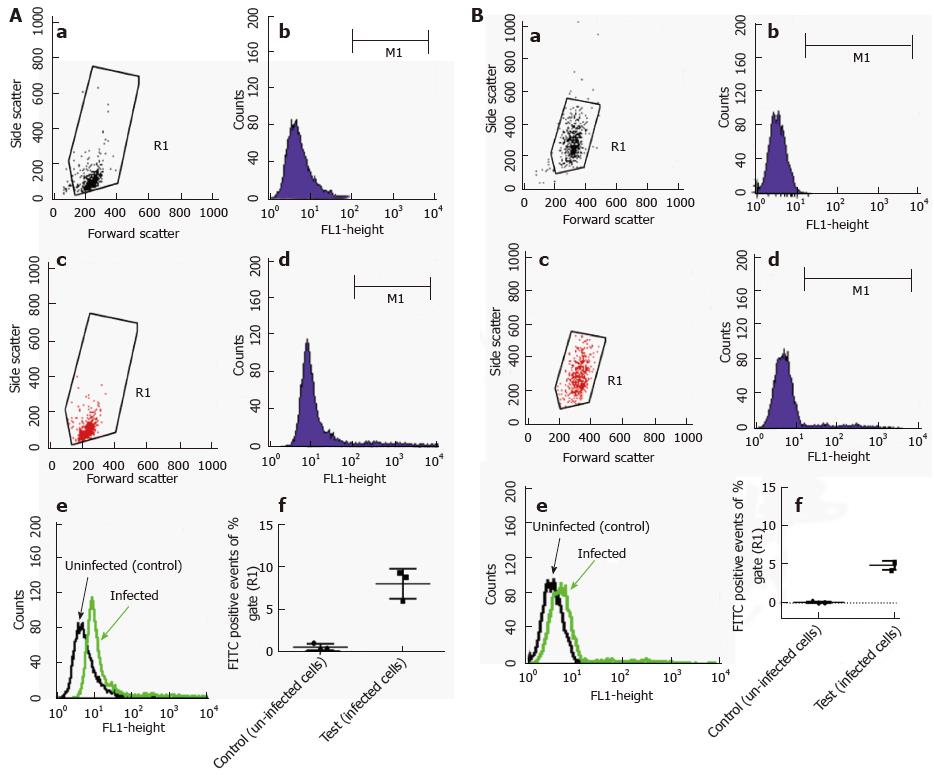
Figure 6 Flow cytometric detection of intracellular fluorescein isothiocyanate labelled Mycobacterium marinum (trypan blue quenching method).
A: bone marrow derived mast cells; B: Human mast cell line. Density plot and histogram to measure R1 gate of uninfected control cells (a, b) and of cells infected with Mycobacterium marinum at MOI 10 for 24 h (c, d); e: Overlay of b and d; f: Portion of fluorescent signal of R1 gate (fluorescein isothiocyanate labelled bacteria), expressed in percentage. This data is a collection of three independent experiments, each performed in duplicate; error bars represent standard deviations. MOI: Multiplicity of infection.
- Citation: Siad S, Byrne S, Mukamolova G, Stover C. Intracellular localisation of Mycobacterium marinum in mast cells. World J Immunol 2016; 6(1): 83-95
- URL: https://www.wjgnet.com/2219-2824/full/v6/i1/83.htm
- DOI: https://dx.doi.org/10.5411/wji.v6.i1.83


