Copyright
©2012 Baishideng Publishing Group Co.
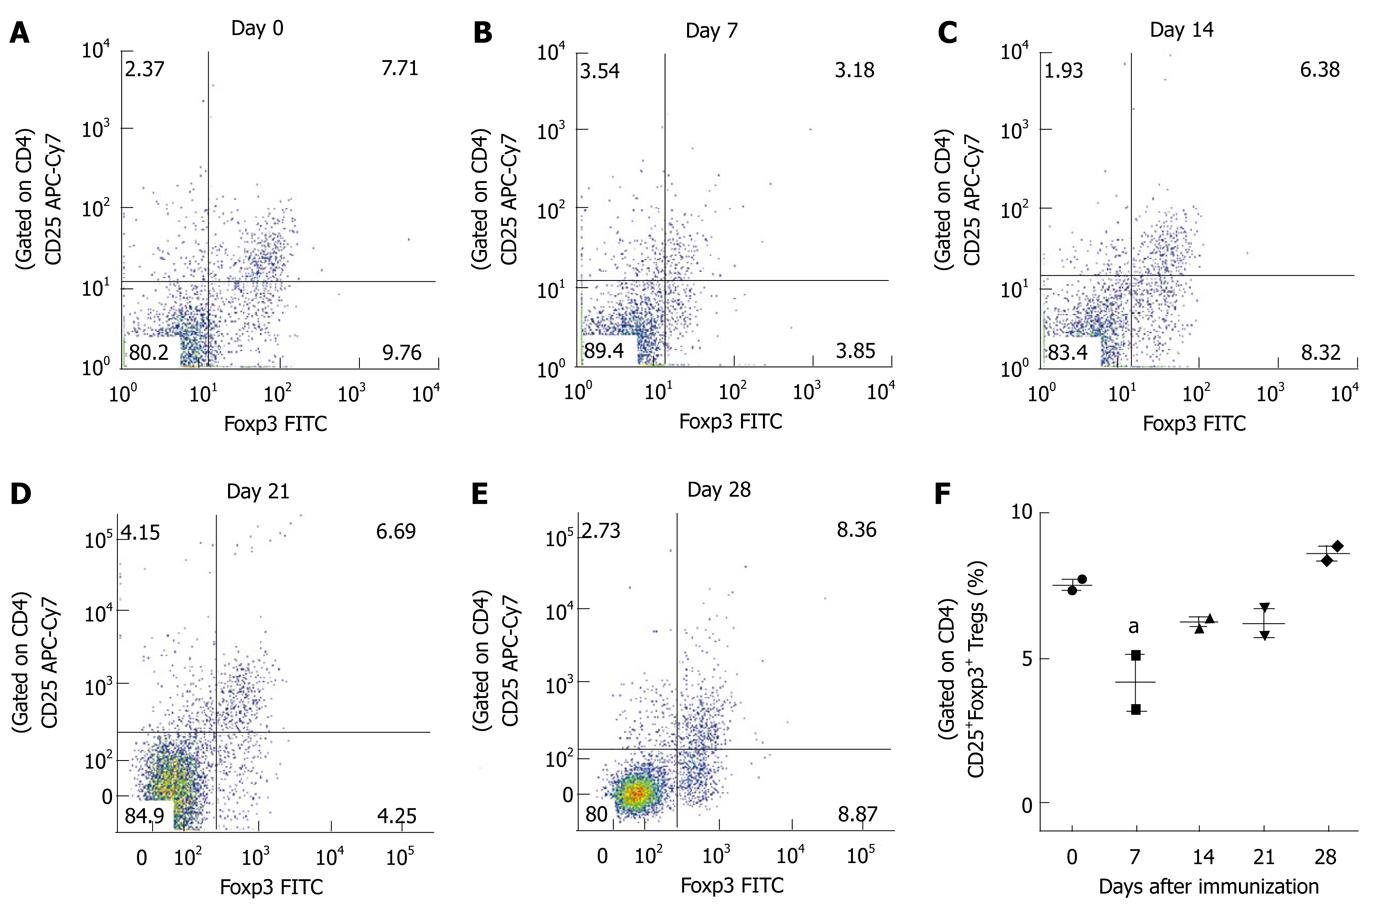
Figure 5 Analysis of regulatory T cells in mice with experimental autoimmune encephalomyelitis.
Spleen cells were isolated from C57BL/6 mice on different days following induction of experimental autoimmune encephalomyelitis. Fresh spleen cells were analyzed for surface antigens CD4 and CD25 and intracellular Foxp3 by flow cytometry. A-E: Representative dot plots show CD25 and Foxp3 expression in CD4+ T cells at different time points; F: The percentages of CD4+CD25+Foxp3+Tregs are shown for each time point and the graph represents the mean ± SE from two independent experiments. The statistical significance is shown as aP < 0.05.
- Citation: Walline CC, Kanakasabai S, Bright JJ. Dynamic interplay of T helpercell subsets in experimental autoimmune encephalomyelitis. World J Immunol 2012; 2(1): 1-13
- URL: https://www.wjgnet.com/2219-2824/full/v2/i1/1.htm
- DOI: https://dx.doi.org/10.5411/wji.v2.i1.1


