Copyright
©2012 Baishideng Publishing Group Co.
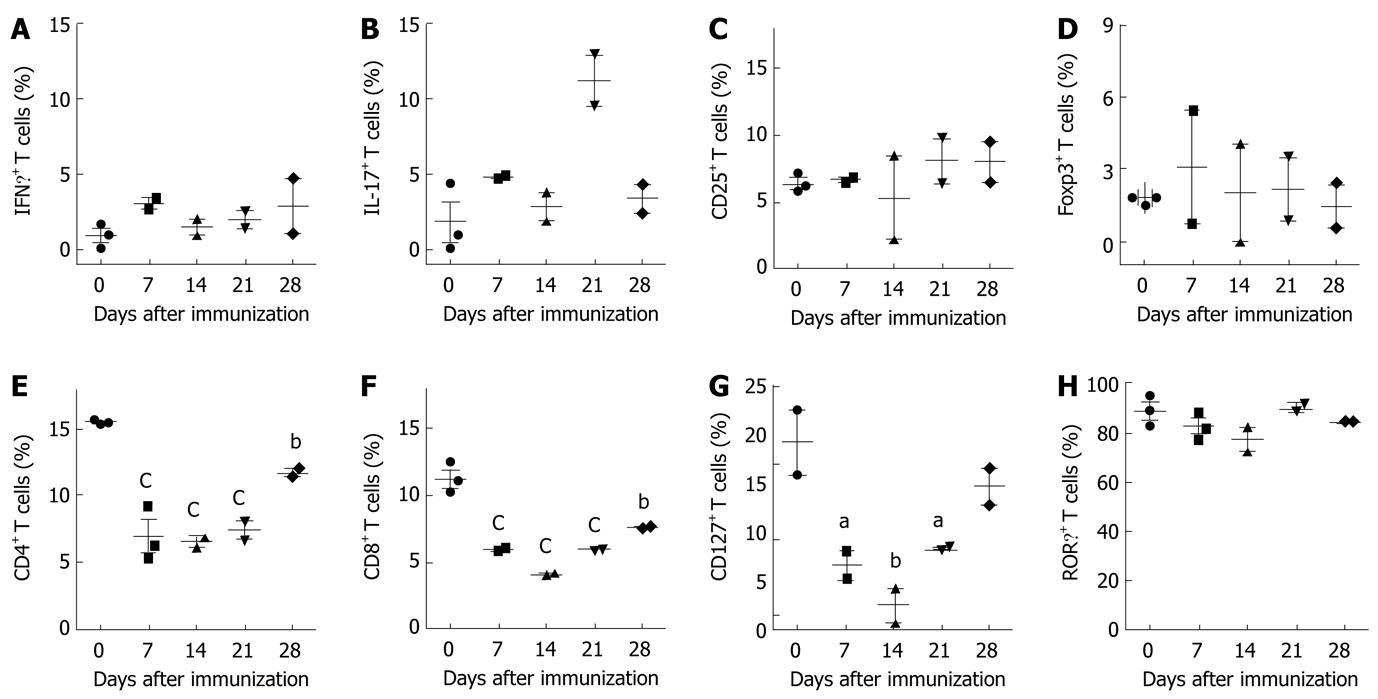
Figure 4 Analysis of T cell activation markers in mice with experimental autoimmune encephalomyelitis.
Spleen cells were isolated from C57BL/6 mice on different days following induction of experimental autoimmune encephalomyelitis. A-B: Cells were cultured with phorbol 12-myristate 13-acetate and ionomycin for 6 h. GolgiStop (monensin) was added for the last 5 h of culture, and intracellular interleukin (IL)-17 and interferon gamma (IFNγ) were analyzed by flow cytometry; C: Fresh spleen cells were analyzed for expression of CD25; D: Foxp3; E: CD4; F: CD8; G: CD127; H: Related orphan receptor gamma (RORγ) by flow cytometry. The graphs show positive cells for selected single stain at each time point and represent the mean ± SE from at least two independent experiments. aP < 0.05, bP < 0.01, cP < 0.001.
- Citation: Walline CC, Kanakasabai S, Bright JJ. Dynamic interplay of T helpercell subsets in experimental autoimmune encephalomyelitis. World J Immunol 2012; 2(1): 1-13
- URL: https://www.wjgnet.com/2219-2824/full/v2/i1/1.htm
- DOI: https://dx.doi.org/10.5411/wji.v2.i1.1


