Copyright
©2014 Baishideng Publishing Group Co.
World J Clin Urol. Mar 24, 2014; 3(1): 47-53
Published online Mar 24, 2014. doi: 10.5410/wjcu.v3.i1.47
Published online Mar 24, 2014. doi: 10.5410/wjcu.v3.i1.47
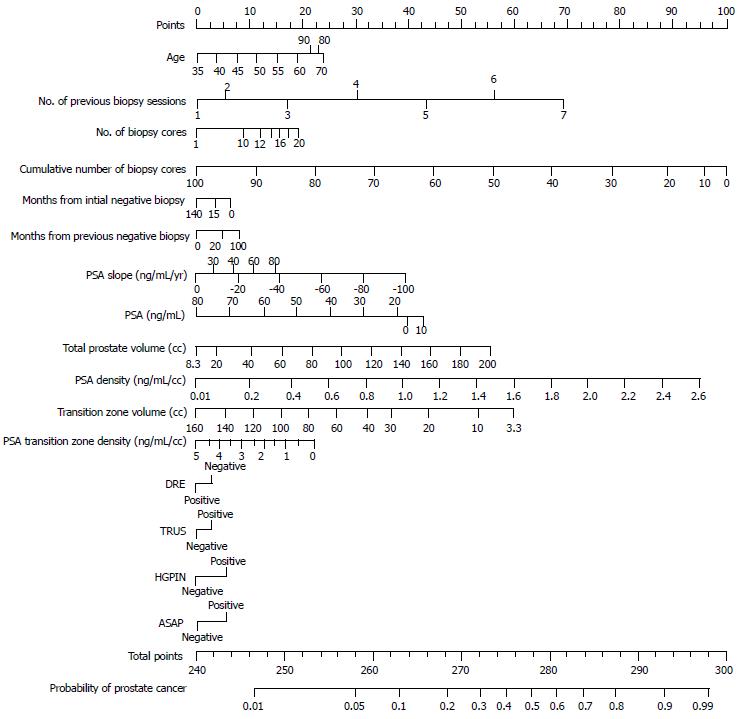
Figure 1 Nomogram (age, number of previous biopsy session, number of biopsy cores, number of previously negative biopsy cores, months from initial biopsy, months from previous biopsy, prostate specific antigen slope, prostate specific antigen, digital rectal exam, transrectal ultrasonography, prostate volume, transition zone volume, prostate specific antigen density, high grade prostatic intraepithelial neoplasia, atypical small acinar proliferation, prostate specific antigen transition zone density) for predicting the probability of a positive repeat biopsy.
Nomogram is used by first locating the patient’s position on each factor axis. Each factor has corresponding prognostic points (top axis). The points for each factor are added to achieve a total point that is subsequently plotted on the total point axis (the second scale from the bottom). The probability of prostate cancer is estimated by drawing a straight line downwards to the bottom line from the location of the total point .TRUS: Transrectal ultrasonography; HGPIN: High grade prostatic intraepithelial neoplasia; ASAP: Atypical small acinar proliferation; TZ: Transitional zone; PSA: Prostatic specific antigen; DRE: Digital rectal exam.
- Citation: Iseki R, Ohori M, Piccorelli A, Yu C, Piccorelli A, Ohno Y, Tachibana M, Kattan MW. Development of a nomogram for predicting a positive repeat prostate biopsy. World J Clin Urol 2014; 3(1): 47-53
- URL: https://www.wjgnet.com/2219-2816/full/v3/i1/47.htm
- DOI: https://dx.doi.org/10.5410/wjcu.v3.i1.47


