Copyright
©The Author(s) 2022.
World J Clin Pediatr. Jan 9, 2022; 11(1): 71-84
Published online Jan 9, 2022. doi: 10.5409/wjcp.v11.i1.71
Published online Jan 9, 2022. doi: 10.5409/wjcp.v11.i1.71
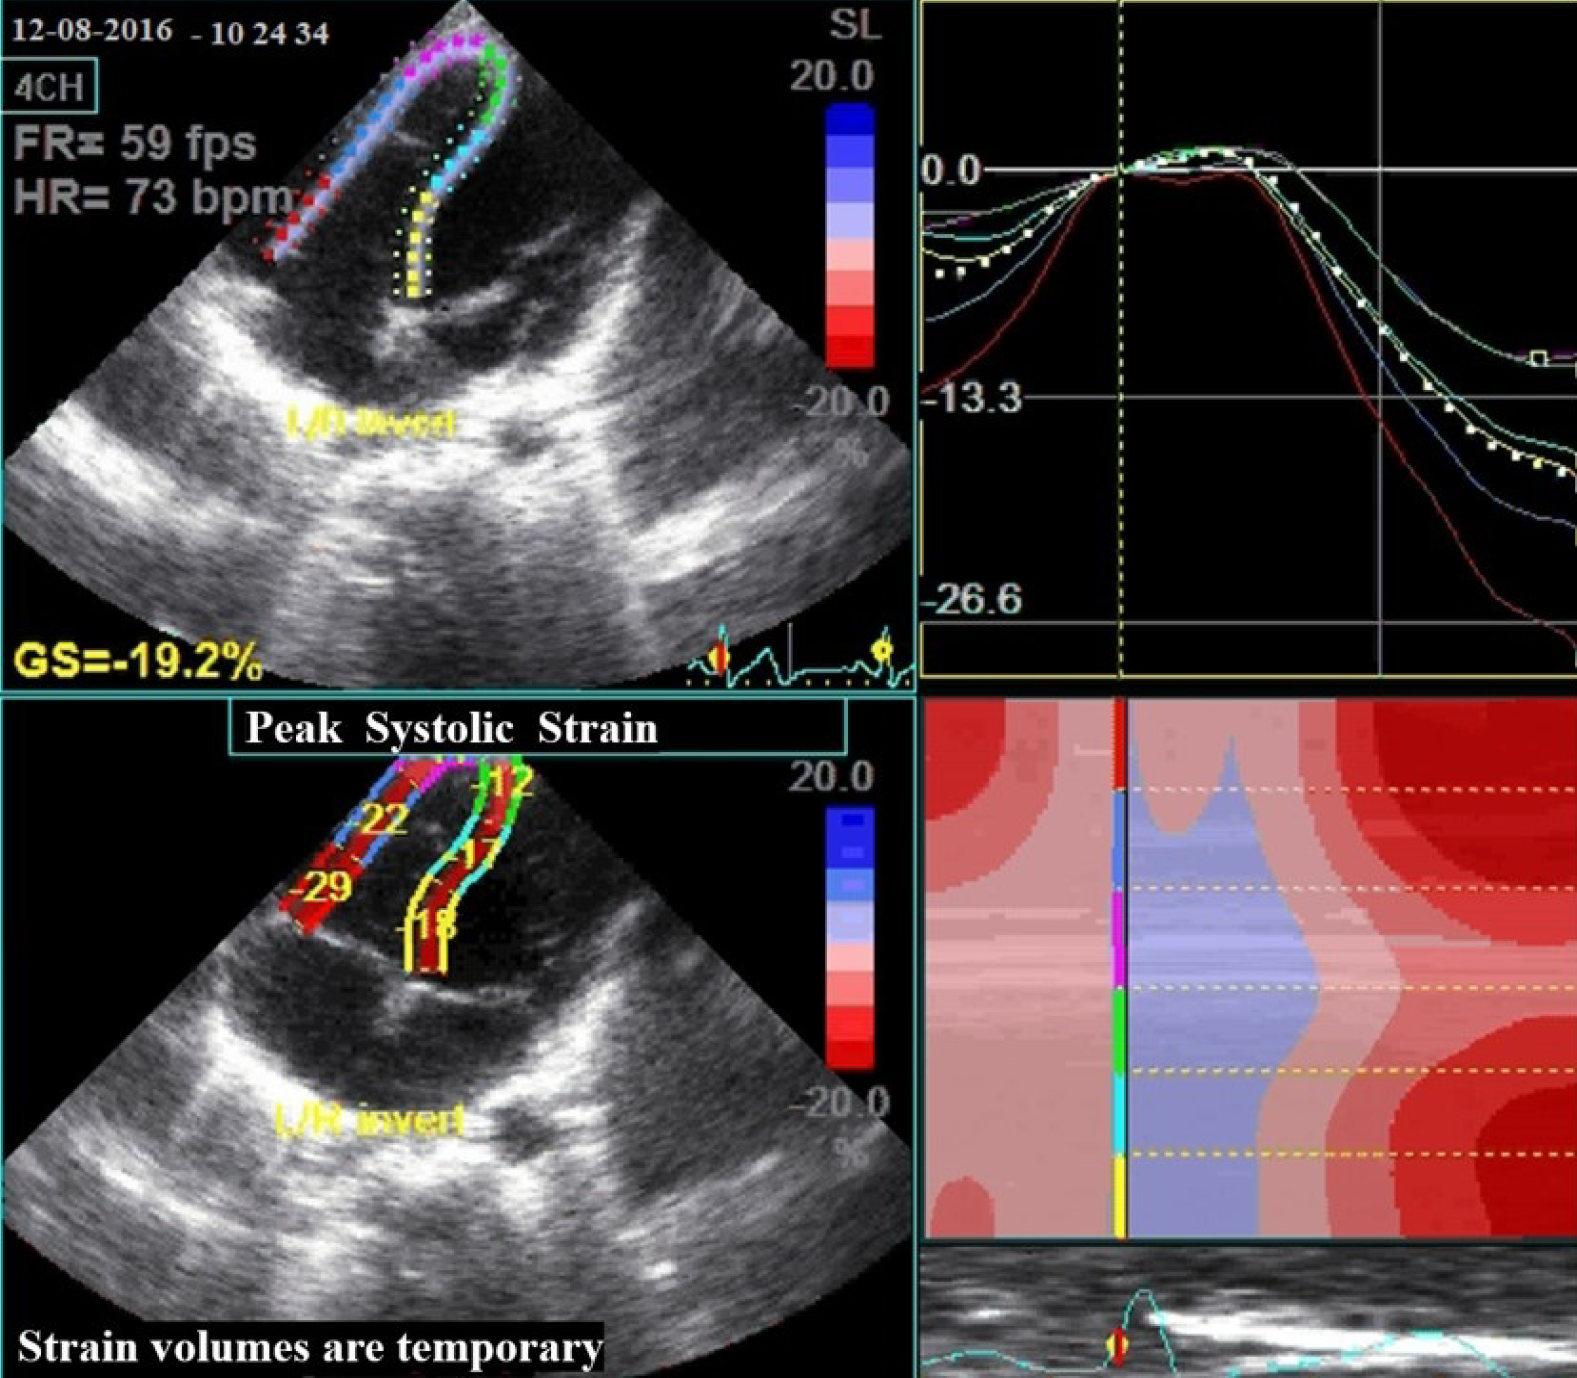
Figure 3 Right ventricular global longitudinal strain measures of a healthy child from the standard four-apical views using two-Dimension speckle tracking method.
The upper left quadrant shows tracking. The right half shows color-coded segmental strain curves and average strain curve (dashed line). The lower left quadrant depicts an anatomic M-mode. The dashed yellow line = Time to peak (from R-wave to maximum systolic strain.
- Citation: Al-Biltagi M, Elrazaky O, Mawlana W, Srour E, Shabana AH. Tissue Doppler, speckling tracking and four-dimensional echocardiographic assessment of right ventricular function in children with dilated cardiomyopathy. World J Clin Pediatr 2022; 11(1): 71-84
- URL: https://www.wjgnet.com/2219-2808/full/v11/i1/71.htm
- DOI: https://dx.doi.org/10.5409/wjcp.v11.i1.71


