Copyright
©The Author(s) 2019.
World J Stomatol. Dec 18, 2019; 7(3): 28-38
Published online Dec 18, 2019. doi: 10.5321/wjs.v7.i3.28
Published online Dec 18, 2019. doi: 10.5321/wjs.v7.i3.28
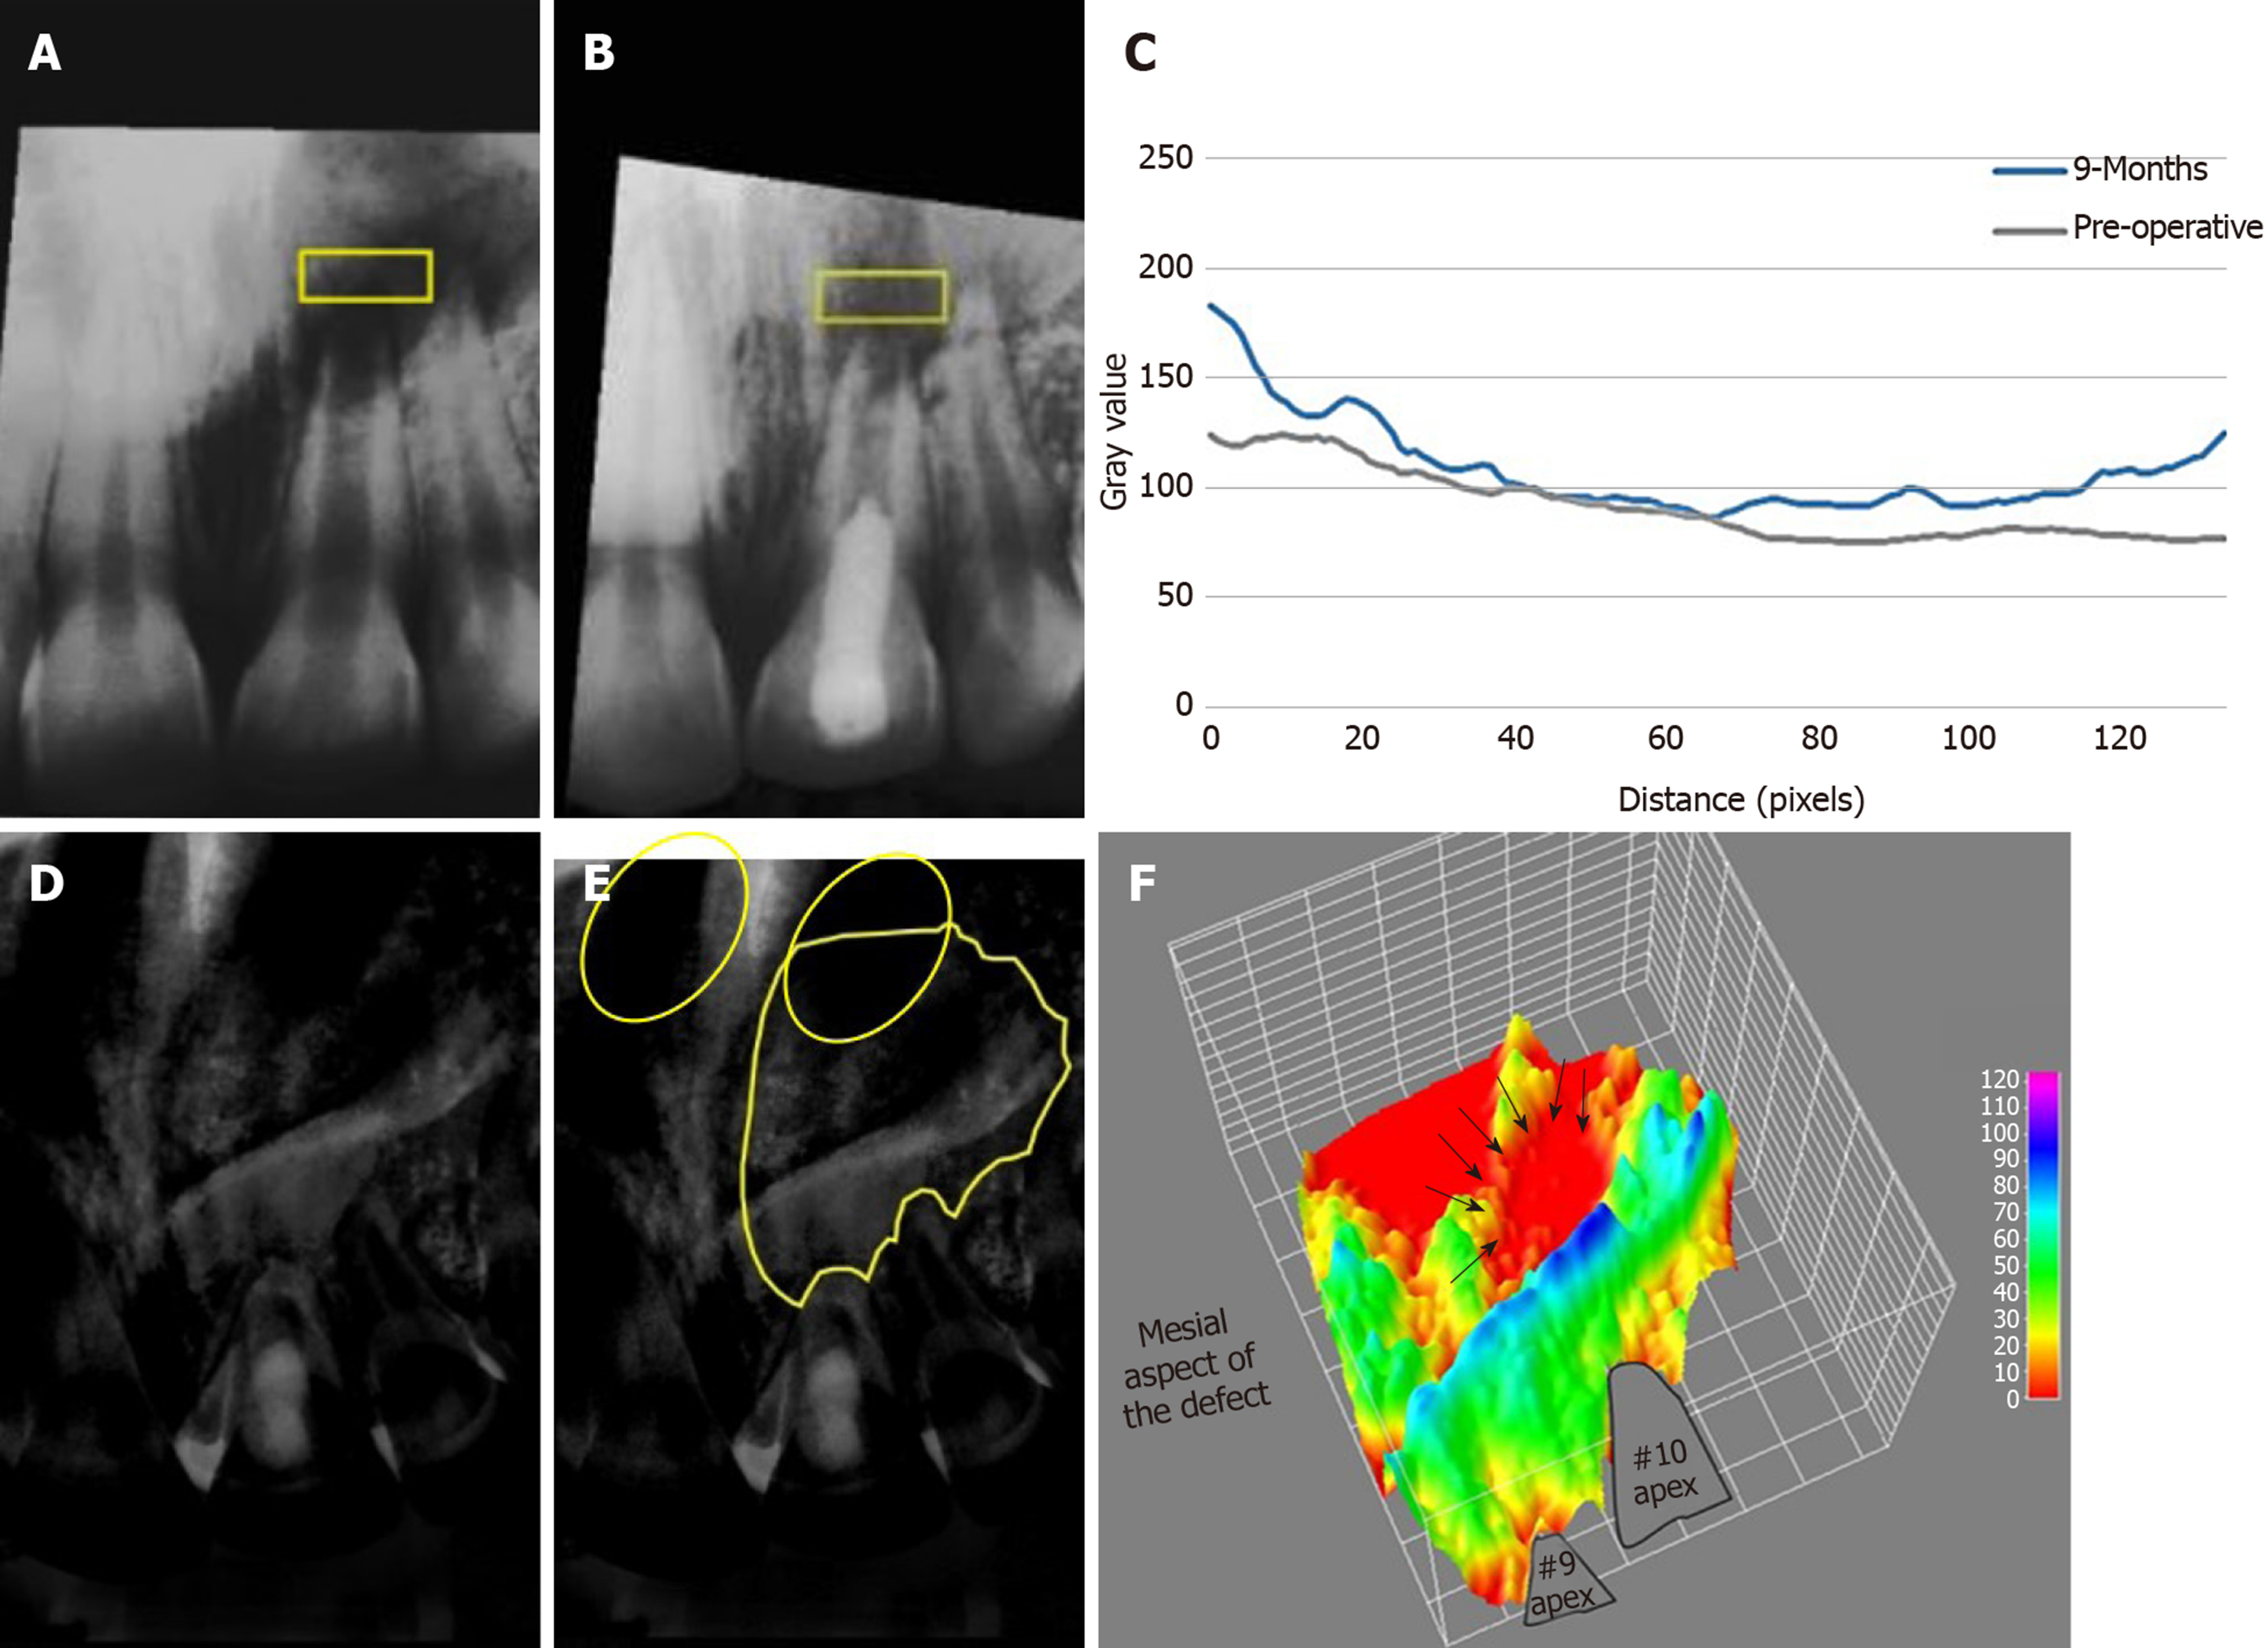
Figure 3 Showing average density changes of the periapical lesion in case#1.
A, B: Average density profile measurement of periapical lesion pre-operatively and after 9 mo, respectively in the selected region of interest (ROI); C: Graph displaying the grey value changes reflecting the increase in bone density after 9 mo; D, E: Image subtraction of occlusal radiographs before and after 9 mo, where E shows the traced ROI to be measured using 3D surface plotting. Note that the left nostril is superimposed with the upper border of the defect circles; F: 3D plot showing change in bone density corresponding to ROI selected in E. Areas in red represent those with the lowest density such as the nostril area and the center of the defect (arrows). The detailed method for measurement of bone density is available in the supplementary material.
- Citation: Eltawila AM, El Backly R. Autologous platelet-rich-fibrin-induced revascularization sequelae: Two case reports. World J Stomatol 2019; 7(3): 28-38
- URL: https://www.wjgnet.com/2218-6263/full/v7/i3/28.htm
- DOI: https://dx.doi.org/10.5321/wjs.v7.i3.28


