Copyright
©The Author(s) 2017.
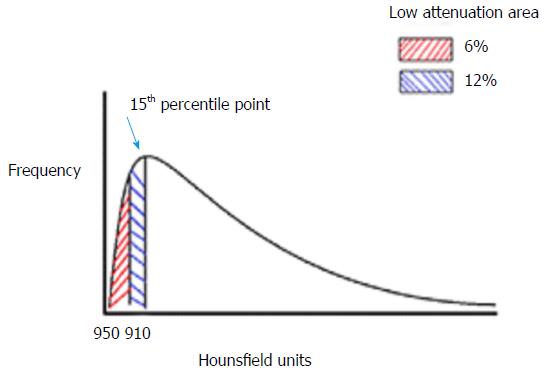
Figure 2 Calculation of densitometric indices.
Example of a density histogram, and how the area under the curve at a given threshold is calculated. In this figure, with a threshold of -910HU, 12% of the pixels are between -910 and -1000HU.
- Citation: Crossley D, Turner A, Subramanian D. Phenotyping emphysema and airways disease: Clinical value of quantitative radiological techniques. World J Respirol 2017; 7(1): 1-16
- URL: https://www.wjgnet.com/2218-6255/full/v7/i1/1.htm
- DOI: https://dx.doi.org/10.5320/wjr.v7.i1.1


