Copyright
©2014 Baishideng Publishing Group Inc.
World J Respirol. Nov 28, 2014; 4(3): 19-25
Published online Nov 28, 2014. doi: 10.5320/wjr.v4.i3.19
Published online Nov 28, 2014. doi: 10.5320/wjr.v4.i3.19
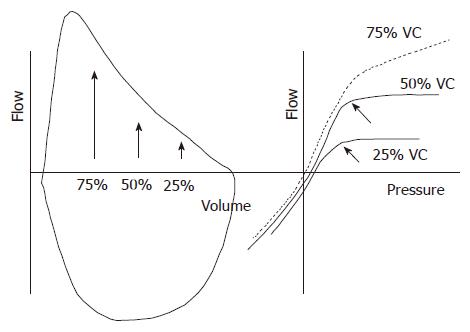
Figure 1 Relationship between maximum flow, volume and pleural pressure.
Left panel: Flow-volume curves during inspiratory and expiratory manoeuvres. The arrows indicate the volume at 75%, 50%, and 25% vital capacity; Right panel: flow and pleural pressure (Ppl) relationships during expiratory manoeuvres at different lung volumes. At 25% and 50% vital capacity (VC) flow plateaus at different pressures (oblique arrows). In contrast, at 75% VC flow keeps increasing with the increase of pressure. The lack of increased expiratory flow at 25% and 50% VC despite the increase in Ppl supports the concept of expiratory flow limitation.
- Citation: Antonelli A, Pellegrino GM, Sferrazza Papa GF, Pellegrino R. Pitfalls in spirometry: Clinical relevance. World J Respirol 2014; 4(3): 19-25
- URL: https://www.wjgnet.com/2218-6255/full/v4/i3/19.htm
- DOI: https://dx.doi.org/10.5320/wjr.v4.i3.19


