Copyright
©2014 Baishideng Publishing Group Inc.
World J Ophthalmol. Nov 12, 2014; 4(4): 113-123
Published online Nov 12, 2014. doi: 10.5318/wjo.v4.i4.113
Published online Nov 12, 2014. doi: 10.5318/wjo.v4.i4.113
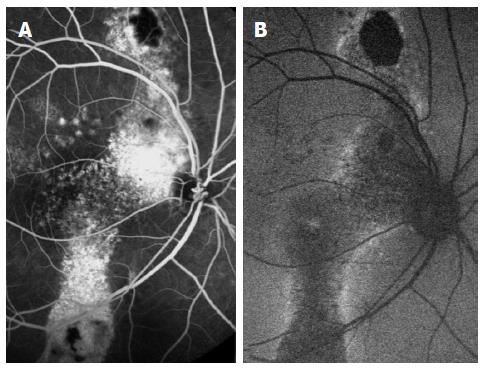
Figure 7 Chronic central serous chorioretinopathy; imaging from the same eye.
Fluorescein angiography (A) with extensive hyperfluorescent areas, corresponding to areas of atrophy, seen as areas of decreased autofluorescence (B). Note the inferior gravitation pattern in both images.
- Citation: Schaap-Fogler M, Ehrlich R. What is new in central serous chorioretinopathy? World J Ophthalmol 2014; 4(4): 113-123
- URL: https://www.wjgnet.com/2218-6239/full/v4/i4/113.htm
- DOI: https://dx.doi.org/10.5318/wjo.v4.i4.113


