Copyright
©2014 Baishideng Publishing Group Inc.
World J Ophthalmol. Aug 12, 2014; 4(3): 47-51
Published online Aug 12, 2014. doi: 10.5318/wjo.v4.i3.47
Published online Aug 12, 2014. doi: 10.5318/wjo.v4.i3.47
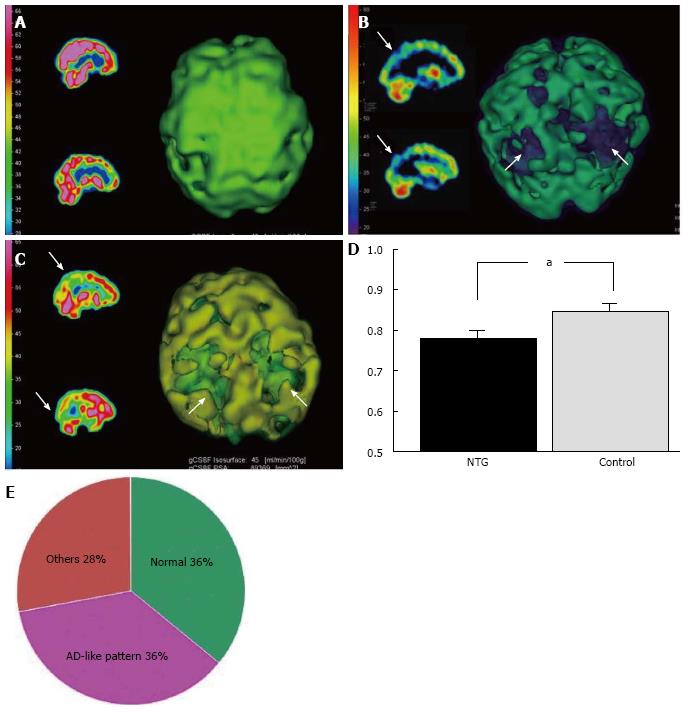
Figure 1 Representative examples of normal, Alzheimer’s disease and Alzheimer’s disease-like cerebral perfusion patterns by SPECT images (sagittal sections and 3D images).
A: Normal pattern; B: AD pattern; C: AD-like pattern. Arrows indicate decreased CBF; D: Comparison of relative CBF in the parietal lobe between NTG patients and controls. aP = 0.02, paired t-test; E: Classification of cerebral perfusion patterns by SPECT images in 64 patients with NTG. AD: Alzheimer’s disease; NTG: Normal tension glaucoma; CBF: Cerebral blood flow.
- Citation: Sugiyama T. Glaucoma and Alzheimer's disease: Their clinical similarity and future therapeutic strategies for glaucoma. World J Ophthalmol 2014; 4(3): 47-51
- URL: https://www.wjgnet.com/2218-6239/full/v4/i3/47.htm
- DOI: https://dx.doi.org/10.5318/wjo.v4.i3.47


