Copyright
©2013 Baishideng Publishing Group Co.
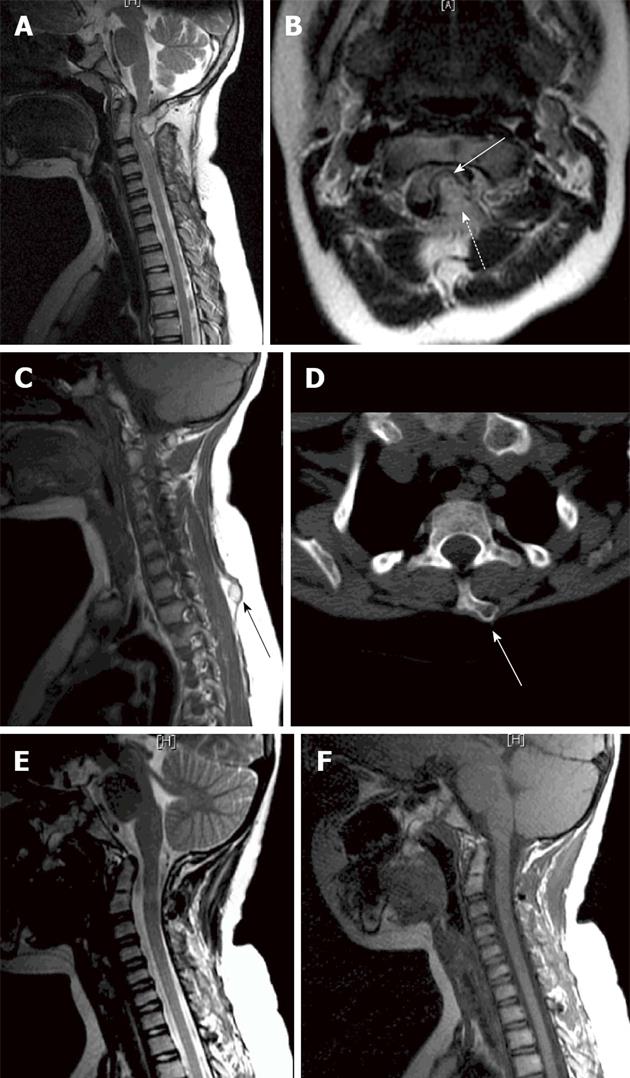
Figure 2 T2, T1-weighted magnetic resonance imaging.
A: T2-weighted magnetic resonance imaging (MRI) sagittal image; B: Axial cut, demonstrating a C1 posterior mass (solid arrows) severely compressing the cord. The mass is hyperintense, whereas the cortical margin is hypointense (dotted arrow); C: T1-weighted MRI sagittal image; D: Bone window computed tomography scan showing T1 spinous process exostosis; E: Postoperative sagittal T2-weighted; F: Postoperative sagittal T1-weighted MRI showing adequate decompression of the spinal cord and no visible lesion.
- Citation: Elgamal EA. Complete recovery of severe tetraparesis after excision of large C1-osteochondroma. World J Neurol 2013; 3(3): 79-82
- URL: https://www.wjgnet.com/2218-6212/full/v3/i3/79.htm
- DOI: https://dx.doi.org/10.5316/wjn.v3.i3.79


