Copyright
©2013 Baishideng Publishing Group Co.
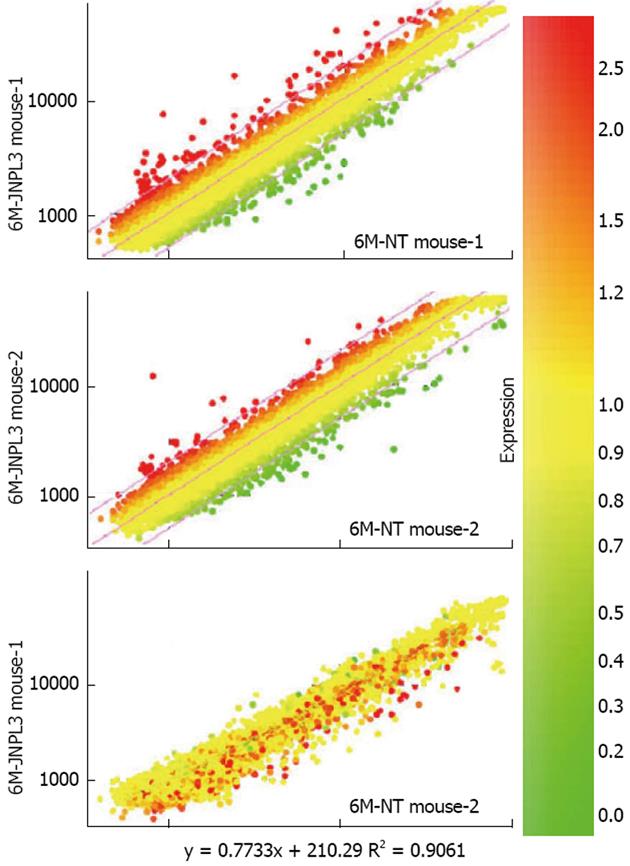
Figure 5 Examples of microarray data obtained from microdissected neurons.
Two microarray experiments using spinal cord motor neurons from four mice were performed. Scatterplots of processed data generated using the program GeneSpring are shown. In each microarray experiment, a Cy3-labeled probe made from approximately 1000 motor neurons from a P301L transgenic mouse was co-hybridized with a Cy5-labeled probe made from approximately 1000 motor neurons from a non-transgenic littermate. The results are shown in the top two scatterplots. The colors of the plotted data are derived from the scale shown at right, indicating the expression fold change. To further examine the quality of the data, a derivative plot was made (bottom). The data from two non-transgenic littermates from the two microarray experiments were plotted against each other. The correlation coefficient of these two biological replicates was r = 0.9 (bottom panel).
- Citation: He Z, Cui L, He B, Ferguson SA, Paule MG. A common genetic mechanism underlying susceptibility to posttraumatic stress disorder. World J Neurol 2013; 3(3): 14-24
- URL: https://www.wjgnet.com/2218-6212/full/v3/i3/14.htm
- DOI: https://dx.doi.org/10.5316/wjn.v3.i3.14


