Copyright
©2013 Baishideng Publishing Group Co.
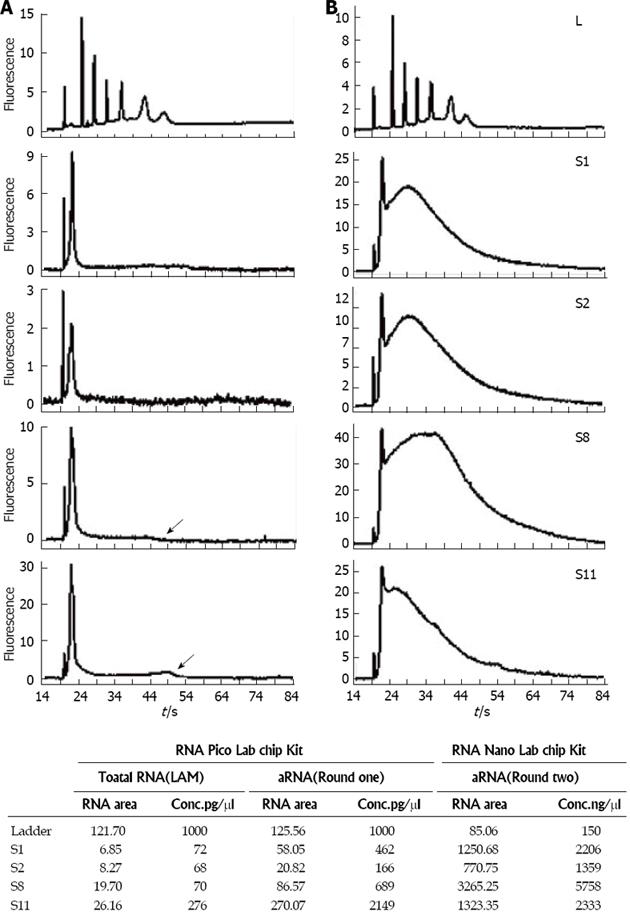
Figure 4 Bioanalyzer profiles of aRNA products from microdissected mouse spinal cord motor neurons using the Arcturus PicoAmp kit.
A and B: These are the standard views obtained from the Bioanalyzer of the Pico Chip and Nano Chip data, providing electrophoretic profiles in time (s). The ladder is shown in the uppermost profiles. Note that the quantity of ladder used in the Pico Chip (A, upper panel) was 1000 pg, but the quantity of ladder used in the Nano Chip (B, upper panel) was 150 ng (150000 pg). Thus, the scales for the Pico Chip (A) and Nano Chip (B) profiles are approximately 150-fold different. The samples shown (S1, S2, S8, and S11) are aRNA products obtained after the first round of PicoAmp amplification (A) and the second round of amplification (B). The black arrowheads in the Pico Chip data for S8 and S11 show visible points of maximal migration for RNA in these two samples; C: RNA concentrations before and after one- and two-rounds of amplifications in 4 representative samples of S1, 2, 8, and 11.
- Citation: He Z, Cui L, He B, Ferguson SA, Paule MG. A common genetic mechanism underlying susceptibility to posttraumatic stress disorder. World J Neurol 2013; 3(3): 14-24
- URL: https://www.wjgnet.com/2218-6212/full/v3/i3/14.htm
- DOI: https://dx.doi.org/10.5316/wjn.v3.i3.14


