Copyright
©2012 Baishideng.
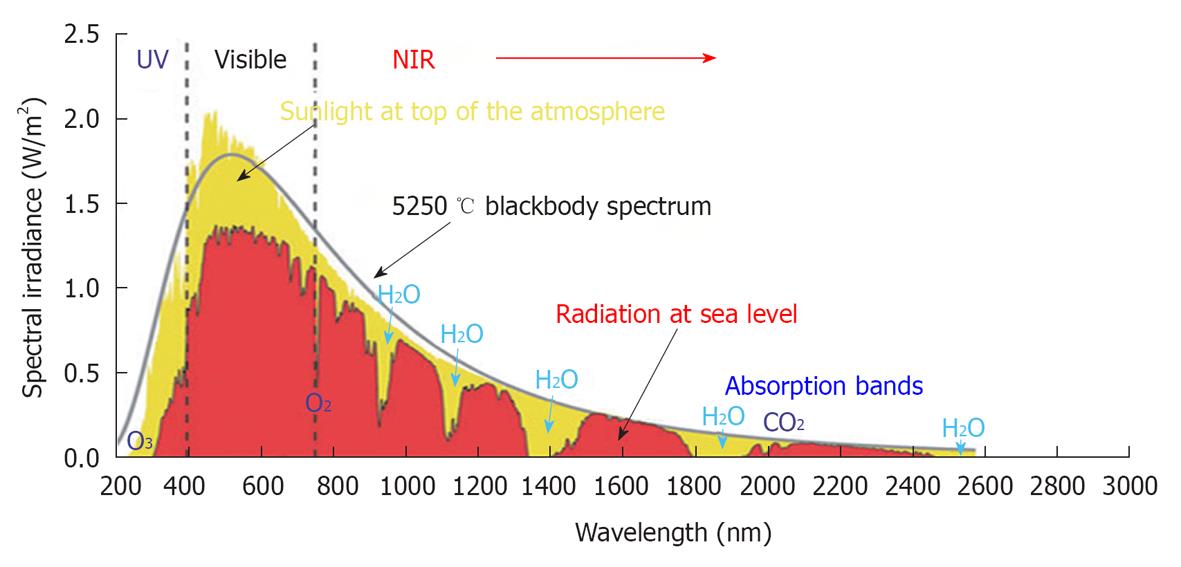
Figure 2 Solar radiation.
This graph shows the radiation spectrum for direct light both at the top of the earth’s atmosphere (yellow) and at sea level (red). The sun produces light with a distribution similar to that expected from a 5250 °C blackbody (gray), which is approximately the temperature of the sun’s surface. As light passes through the atmosphere, some is absorbed by gases with specific absorption bands (blue). These curves are based on the American Society for Testing and Materials Terrestrial Reference Spectra, which are standards adopted by the photovoltaic industry to ensure consistent test conditions and are similar to the light levels expected in North America. Regions for ultraviolet, visible and near-infrared are indicated. Cited and revised from Figure 2 of reference 3.
- Citation: Tanaka Y. Impact of near-infrared radiation in dermatology. World J Dermatol 2012; 1(3): 30-37
- URL: https://www.wjgnet.com/2218-6190/full/v1/i3/30.htm
- DOI: https://dx.doi.org/10.5314/wjd.v1.i3.30


