Copyright
©2014 Baishideng Publishing Group Co.
World J Anesthesiol. Mar 27, 2014; 3(1): 134-136
Published online Mar 27, 2014. doi: 10.5313/wja.v3.i1.134
Published online Mar 27, 2014. doi: 10.5313/wja.v3.i1.134
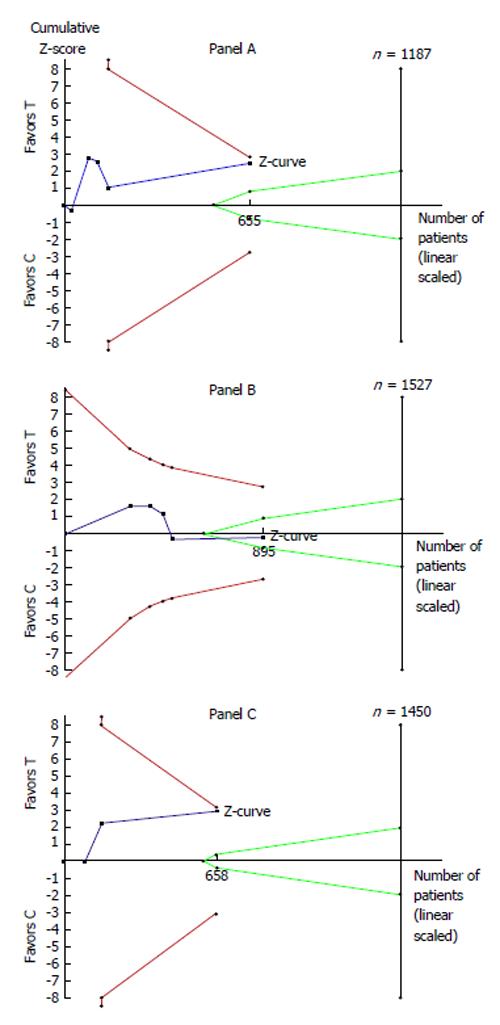
Figure 1 Trial sequential analysis of 10 randomized controlled trials evaluating dexmedetomidine vs propofol according to the end-points of length of Intensive Care Unit stay (in days, Panel A), length of mechanical ventilation (in days, Panel B) and delirium episodes (Panel C).
In the Z-curve (represented in blue), individual trials correspond to individual segments; trials are plotted in chronological order (from left to right). The X-axis indicates the cumulative number of patients; the starting point of the Z-curve is always at X = 0, i.e., inclusion of no trials. Abbreviations and symbols: Red lines are the boundaries for superiority or inferiority, and green lines for futility (i.e., proof of no incremental effectiveness). T: Treatment arm (dexmedetomidine); C: Control arm (propofol).
-
Citation: Fadda V, Maratea D, Trippoli S, Messori A. Dexmedetomidine
vs propofol in intensive care unit patients. World J Anesthesiol 2014; 3(1): 134-136 - URL: https://www.wjgnet.com/2218-6182/full/v3/i1/134.htm
- DOI: https://dx.doi.org/10.5313/wja.v3.i1.134


