Copyright
©The Author(s) 2017.
World J Orthop. Sep 18, 2017; 8(9): 660-673
Published online Sep 18, 2017. doi: 10.5312/wjo.v8.i9.660
Published online Sep 18, 2017. doi: 10.5312/wjo.v8.i9.660
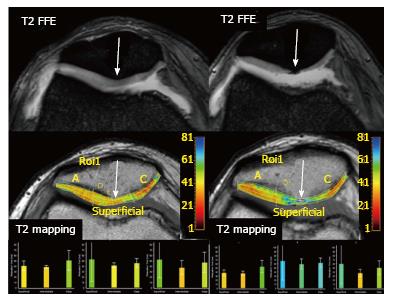
Figure 4 Osteoarthritis progression.
A 49-year-old woman with knee pain is studied with two consecutive MRI studies. The first MRI (left images) shows a moderate joint effusion with patchy areas of increased signal intensity on T2 FFE sequence within the patellar cartilage. T2 mapping demonstrates diffuse increase in T2 relaxation times, more conspicuous at the patellar apex (arrows) consistent with early cartilage damage. Follow-up MRI performed 15 mo later (right images), demonstrates severe cartilage thinning, especially at patellar apex, that correlates with a severe increase in T2 relaxation times on the T2 mapping study. This clinical example demonstrates how T2 mapping can help to detect patients with evidence of early OA. MRI: Magnetic resonance imaging; OA: Osteoarthritis.
- Citation: Martín Noguerol T, Luna A, Gómez Cabrera M, Riofrio AD. Clinical applications of advanced magnetic resonance imaging techniques for arthritis evaluation. World J Orthop 2017; 8(9): 660-673
- URL: https://www.wjgnet.com/2218-5836/full/v8/i9/660.htm
- DOI: https://dx.doi.org/10.5312/wjo.v8.i9.660


