Copyright
©The Author(s) 2017.
World J Orthop. Aug 18, 2017; 8(8): 644-650
Published online Aug 18, 2017. doi: 10.5312/wjo.v8.i8.644
Published online Aug 18, 2017. doi: 10.5312/wjo.v8.i8.644
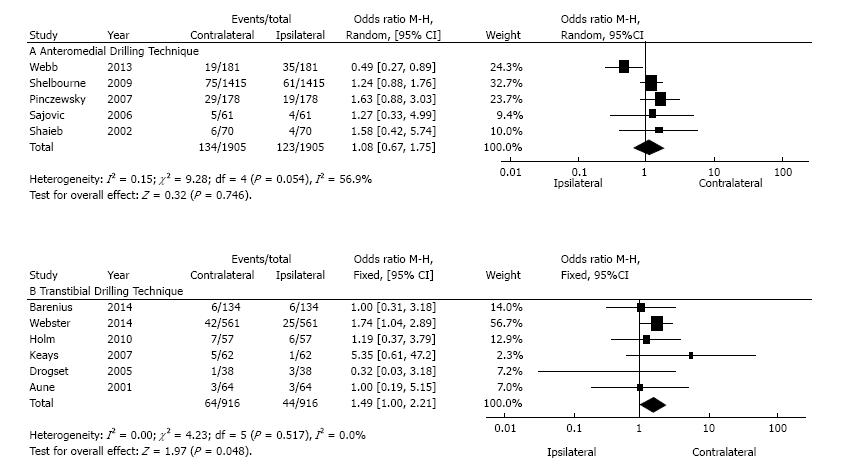
Figure 3 Results of individual studies along with a Forest plot that graphically displays the point estimates on a common scale surrounded by the 95%CI (indicated by the horizontal lines).
The diamond represents the pooled effect between studies. M-H: Mantel-Haenszel; df: Degrees of freedom.
- Citation: de Campos GC, Teixeira PEP, Castro A, Alves Junior WM. Femoral positioning influences ipsi-and contralateral anterior cruciate ligament rupture following its reconstruction: Systematic review and meta-analysis. World J Orthop 2017; 8(8): 644-650
- URL: https://www.wjgnet.com/2218-5836/full/v8/i8/644.htm
- DOI: https://dx.doi.org/10.5312/wjo.v8.i8.644


