Copyright
©The Author(s) 2017.
World J Orthop. May 18, 2017; 8(5): 385-393
Published online May 18, 2017. doi: 10.5312/wjo.v8.i5.385
Published online May 18, 2017. doi: 10.5312/wjo.v8.i5.385
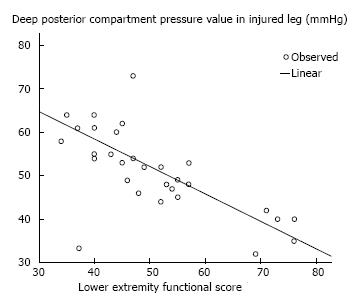
Figure 6 Negative correlation plot of lower extremity functional scale with rising pressure (Pearson’s R = -0.
814, P < 0.001).
- Citation: Goyal S, Naik MA, Tripathy SK, Rao SK. Functional outcome of tibial fracture with acute compartment syndrome and correlation to deep posterior compartment pressure. World J Orthop 2017; 8(5): 385-393
- URL: https://www.wjgnet.com/2218-5836/full/v8/i5/385.htm
- DOI: https://dx.doi.org/10.5312/wjo.v8.i5.385


