Copyright
©The Author(s) 2017.
World J Orthop. Feb 18, 2017; 8(2): 130-141
Published online Feb 18, 2017. doi: 10.5312/wjo.v8.i2.130
Published online Feb 18, 2017. doi: 10.5312/wjo.v8.i2.130
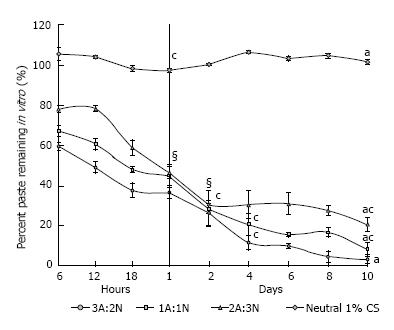
Figure 3 In vitro enzymatic degradation reported as the average ± standard deviation of weight percent remaining of the sample for 3A:2N, 1A:1N, and 2A:3N chitosan/ polyethylene glycol paste variations and neutral 1% chitosan sponges over 10 d (n = 5).
aP < 0.05 vs each other at all time points except § for all pastes at day 2 and 2A:3N and 1A:1N at day 1; cP < 0.05 showing significant degradation through marked time points.
- Citation: Rhodes CS, Alexander CM, Berretta JM, Courtney HS, Beenken KE, Smeltzer MS, Bumgardner JD, Haggard WO, Jennings JA. Evaluation of a chitosan-polyethylene glycol paste as a local antibiotic delivery device. World J Orthop 2017; 8(2): 130-141
- URL: https://www.wjgnet.com/2218-5836/full/v8/i2/130.htm
- DOI: https://dx.doi.org/10.5312/wjo.v8.i2.130


