Copyright
©The Author(s) 2017.
World J Orthop. Dec 18, 2017; 8(12): 895-901
Published online Dec 18, 2017. doi: 10.5312/wjo.v8.i12.895
Published online Dec 18, 2017. doi: 10.5312/wjo.v8.i12.895
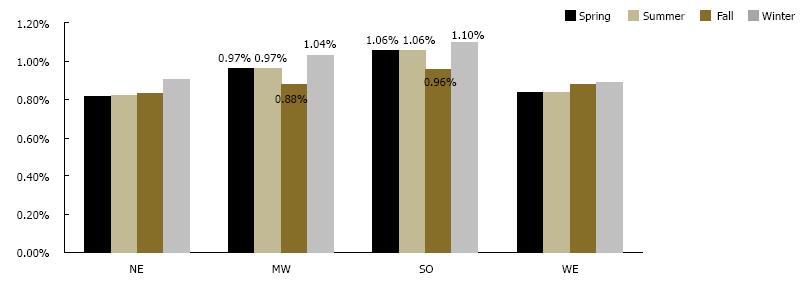
Figure 2 Incidence of periprosthetic infection following total hip arthroplasty by region of the United States.
Values are shown for the regions, which had a significant difference. There was a significant difference in periprosthetic joint infections in two out of the four regions, Midwest and South (P = 0.013 and P = 0.007 respectively). NE: North East; MW: Mid West; WE: West; SO: South.
- Citation: Rosas S, Ong AC, Buller LT, Sabeh KG, Law TY, Roche MW, Hernandez VH. Season of the year influences infection rates following total hip arthroplasty. World J Orthop 2017; 8(12): 895-901
- URL: https://www.wjgnet.com/2218-5836/full/v8/i12/895.htm
- DOI: https://dx.doi.org/10.5312/wjo.v8.i12.895


