Copyright
©The Author(s) 2016.
World J Orthop. Jul 18, 2016; 7(7): 426-433
Published online Jul 18, 2016. doi: 10.5312/wjo.v7.i7.426
Published online Jul 18, 2016. doi: 10.5312/wjo.v7.i7.426
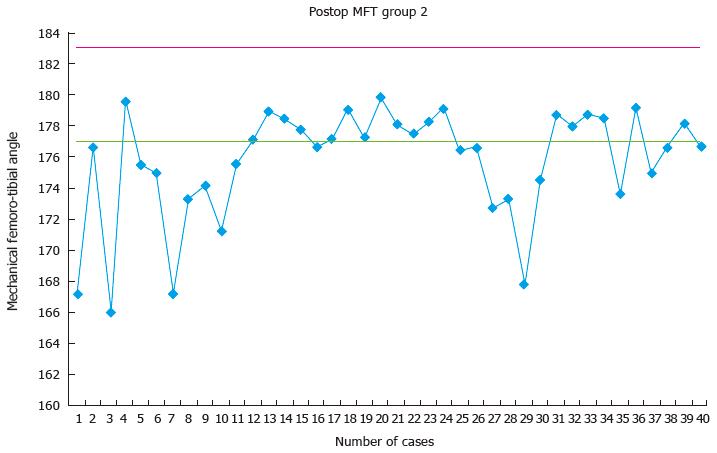
Figure 6 Scatter diagram depicting the distribution of the post-operative mechanical femoro-tibial angle (mechanical femoro-tibial angle) in the conventional instrument group (group 2).
MFT: Mechanical femoro-tibial angle.
- Citation: Vaishya R, Vijay V, Birla VP, Agarwal AK. Computerized tomography based “patient specific blocks” improve postoperative mechanical alignment in primary total knee arthroplasty. World J Orthop 2016; 7(7): 426-433
- URL: https://www.wjgnet.com/2218-5836/full/v7/i7/426.htm
- DOI: https://dx.doi.org/10.5312/wjo.v7.i7.426


