Copyright
©The Author(s) 2016.
World J Orthop. Jun 18, 2016; 7(6): 383-391
Published online Jun 18, 2016. doi: 10.5312/wjo.v7.i6.383
Published online Jun 18, 2016. doi: 10.5312/wjo.v7.i6.383
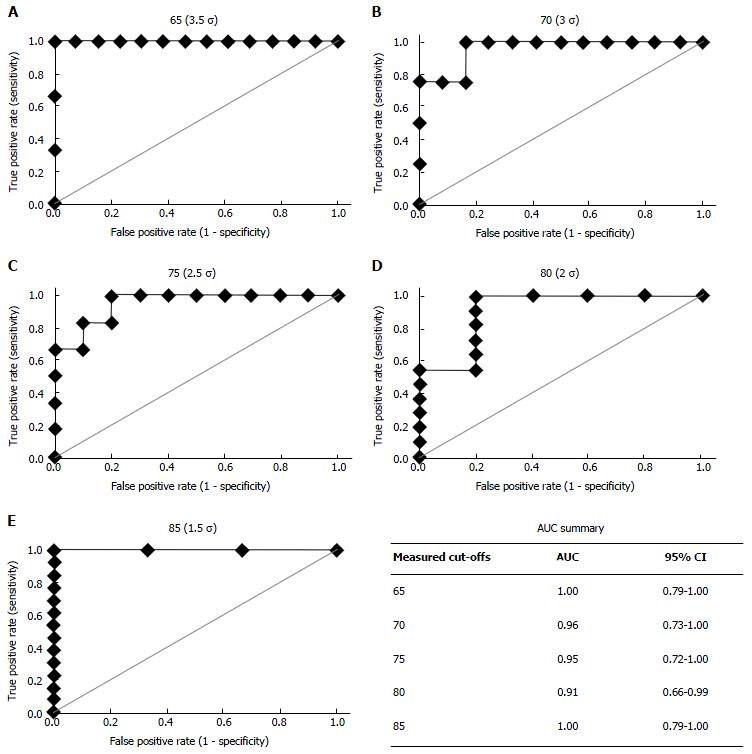
Figure 2 Receiver operating characteristic curves for a range of measured cut-offs [65-85 (A-E), or 3.
5-1.5 (A-E) standard deviations (σ) away from the able-bodied mean] for the predictive equation comprised of six-minute walk distance, AM_C, tstand and age. Also included in the bottom right cell are mean values and 95%CIs for AUC for each of the measured cut-offs. AM_C: Over the past four weeks, rate your ability to walk up stairs when using your prosthesis; tstand: Time taken to stand; AUC: Area under the curve.
- Citation: Kark L, Odell R, McIntosh AS, Simmons A. Quantifying prosthetic gait deviation using simple outcome measures. World J Orthop 2016; 7(6): 383-391
- URL: https://www.wjgnet.com/2218-5836/full/v7/i6/383.htm
- DOI: https://dx.doi.org/10.5312/wjo.v7.i6.383


