Copyright
©The Author(s) 2016.
World J Orthop. Dec 18, 2016; 7(12): 821-825
Published online Dec 18, 2016. doi: 10.5312/wjo.v7.i12.821
Published online Dec 18, 2016. doi: 10.5312/wjo.v7.i12.821
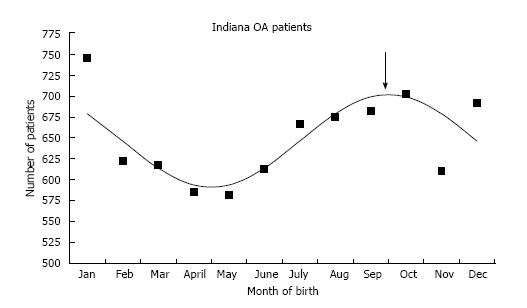
Figure 1 The cosinor fit for Indiana patients with hip osteoarthritis and month of birth.
The best fit is represented by the equation: Number of OA births = 646.4 + 55.3 [cos(36t - 18)-324], where t = 1 is January, 2 is February, 3 is March, etc. This was statistically significant (r2 = 0.56, P = 0.025). The peak is 1st October (solid arrow). The data points are the black triangles and the best fit represented by the bold black line. OA: Osteoarthritis.
- Citation: Sueyoshi T, Ritter MA, Davis KE, Loder RT. Seasonal variation in adult hip disease secondary to osteoarthritis and developmental dysplasia of the hip. World J Orthop 2016; 7(12): 821-825
- URL: https://www.wjgnet.com/2218-5836/full/v7/i12/821.htm
- DOI: https://dx.doi.org/10.5312/wjo.v7.i12.821


