Copyright
©The Author(s) 2015.
World J Orthop. Sep 18, 2015; 6(8): 567-576
Published online Sep 18, 2015. doi: 10.5312/wjo.v6.i8.567
Published online Sep 18, 2015. doi: 10.5312/wjo.v6.i8.567
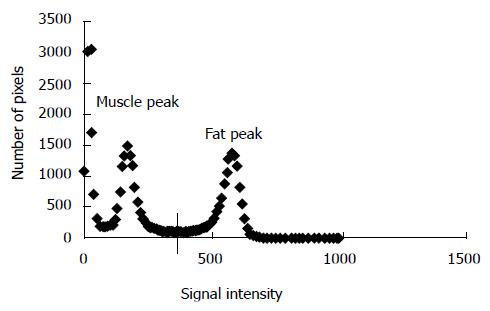
Figure 1 Histogram analysis of the whole thigh region representing both muscle (left) and fat (right) peaks as well as the mid-point signal intensity that is used a cut-off point to separate between muscle or inter-intra-muscular fat pixels.
- Citation: Gorgey AS, Wells KM, Austin TL. Adiposity and spinal cord injury. World J Orthop 2015; 6(8): 567-576
- URL: https://www.wjgnet.com/2218-5836/full/v6/i8/567.htm
- DOI: https://dx.doi.org/10.5312/wjo.v6.i8.567


