Copyright
©The Author(s) 2015.
World J Orthop. Jun 18, 2015; 6(5): 421-433
Published online Jun 18, 2015. doi: 10.5312/wjo.v6.i5.421
Published online Jun 18, 2015. doi: 10.5312/wjo.v6.i5.421
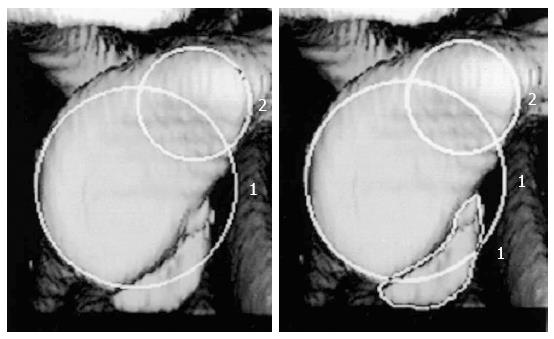
Figure 2 Using 3D reconstruction computed tomography the size o f the defect is calculated as the percentage of the on fossa glenoid.
Using circle 2 as the reference selected by the radiologist, the CT software automatically calculates the deficit by using the equation (area of the deficit/circle 1 × 100%). Adapted with permission from JBJS Am 2003; 85-A: 878-884.
- Citation: Garcia GH, Liu JN, Dines DM, Dines JS. Effect of bone loss in anterior shoulder instability. World J Orthop 2015; 6(5): 421-433
- URL: https://www.wjgnet.com/2218-5836/full/v6/i5/421.htm
- DOI: https://dx.doi.org/10.5312/wjo.v6.i5.421


