Copyright
©The Author(s) 2015.
World J Orthop. Mar 18, 2015; 6(2): 221-235
Published online Mar 18, 2015. doi: 10.5312/wjo.v6.i2.221
Published online Mar 18, 2015. doi: 10.5312/wjo.v6.i2.221
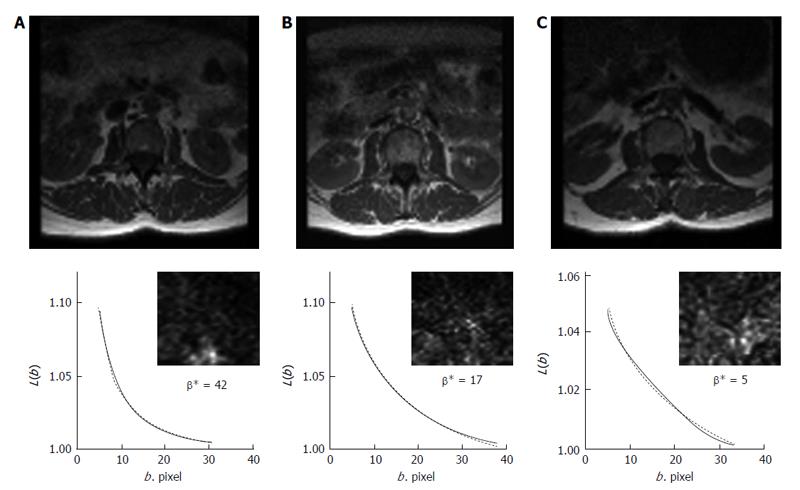
Figure 8 Example of results from lacunarity analysis of three types of trabecular bone different for age and healthy status.
In the related plots, dotted lines represent the fitted hyperbola function. Goodness of the fitting represented by a almost complete overlapping of both theoric and experimental curve indicates that parametric lacunarity analysis by hyperbola model function is a proper choice. A: Young, 39s; B: Menopause, 53s; C: Osteoporosis, 74s.
- Citation: Zaia A. Fractal lacunarity of trabecular bone and magnetic resonance imaging: New perspectives for osteoporotic fracture risk assessment. World J Orthop 2015; 6(2): 221-235
- URL: https://www.wjgnet.com/2218-5836/full/v6/i2/221.htm
- DOI: https://dx.doi.org/10.5312/wjo.v6.i2.221


