Copyright
©The Author(s) 2015.
World J Orthop. Mar 18, 2015; 6(2): 221-235
Published online Mar 18, 2015. doi: 10.5312/wjo.v6.i2.221
Published online Mar 18, 2015. doi: 10.5312/wjo.v6.i2.221
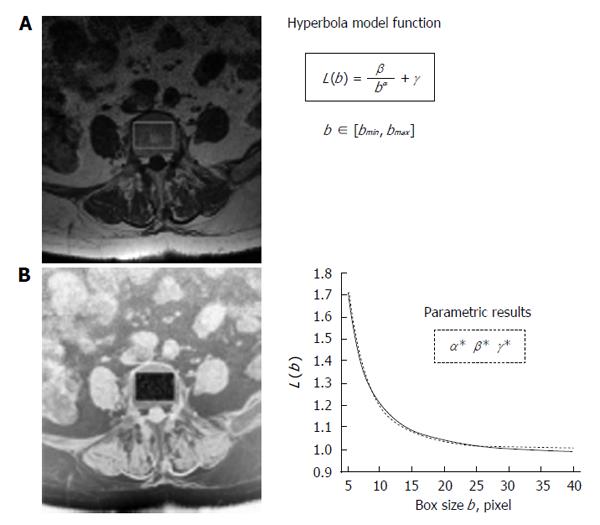
Figure 1 Schematic representation of fractal lacunarity analysis.
A: 1.5 T MRI spin-echo image (512 × 512 pixel, pixel size equal to 0.469 mm) of fifth axial section of lumbar vertebra; B: Rectangular ROI within the inner perimeter of vertebral body in a intermediate step of binarization procedure on the reverse gray-scale image. The plot (right bottom) represents the result of gliding box algorithm application (dotted line) as fitted by hyperbola function (solid line) used to calculate the triplet of parameters α, β, γ. MRI: Magnetic resonance imaging; ROI: Region of interest.
- Citation: Zaia A. Fractal lacunarity of trabecular bone and magnetic resonance imaging: New perspectives for osteoporotic fracture risk assessment. World J Orthop 2015; 6(2): 221-235
- URL: https://www.wjgnet.com/2218-5836/full/v6/i2/221.htm
- DOI: https://dx.doi.org/10.5312/wjo.v6.i2.221


