Copyright
©The Author(s) 2025.
World J Orthop. Feb 18, 2025; 16(2): 102483
Published online Feb 18, 2025. doi: 10.5312/wjo.v16.i2.102483
Published online Feb 18, 2025. doi: 10.5312/wjo.v16.i2.102483
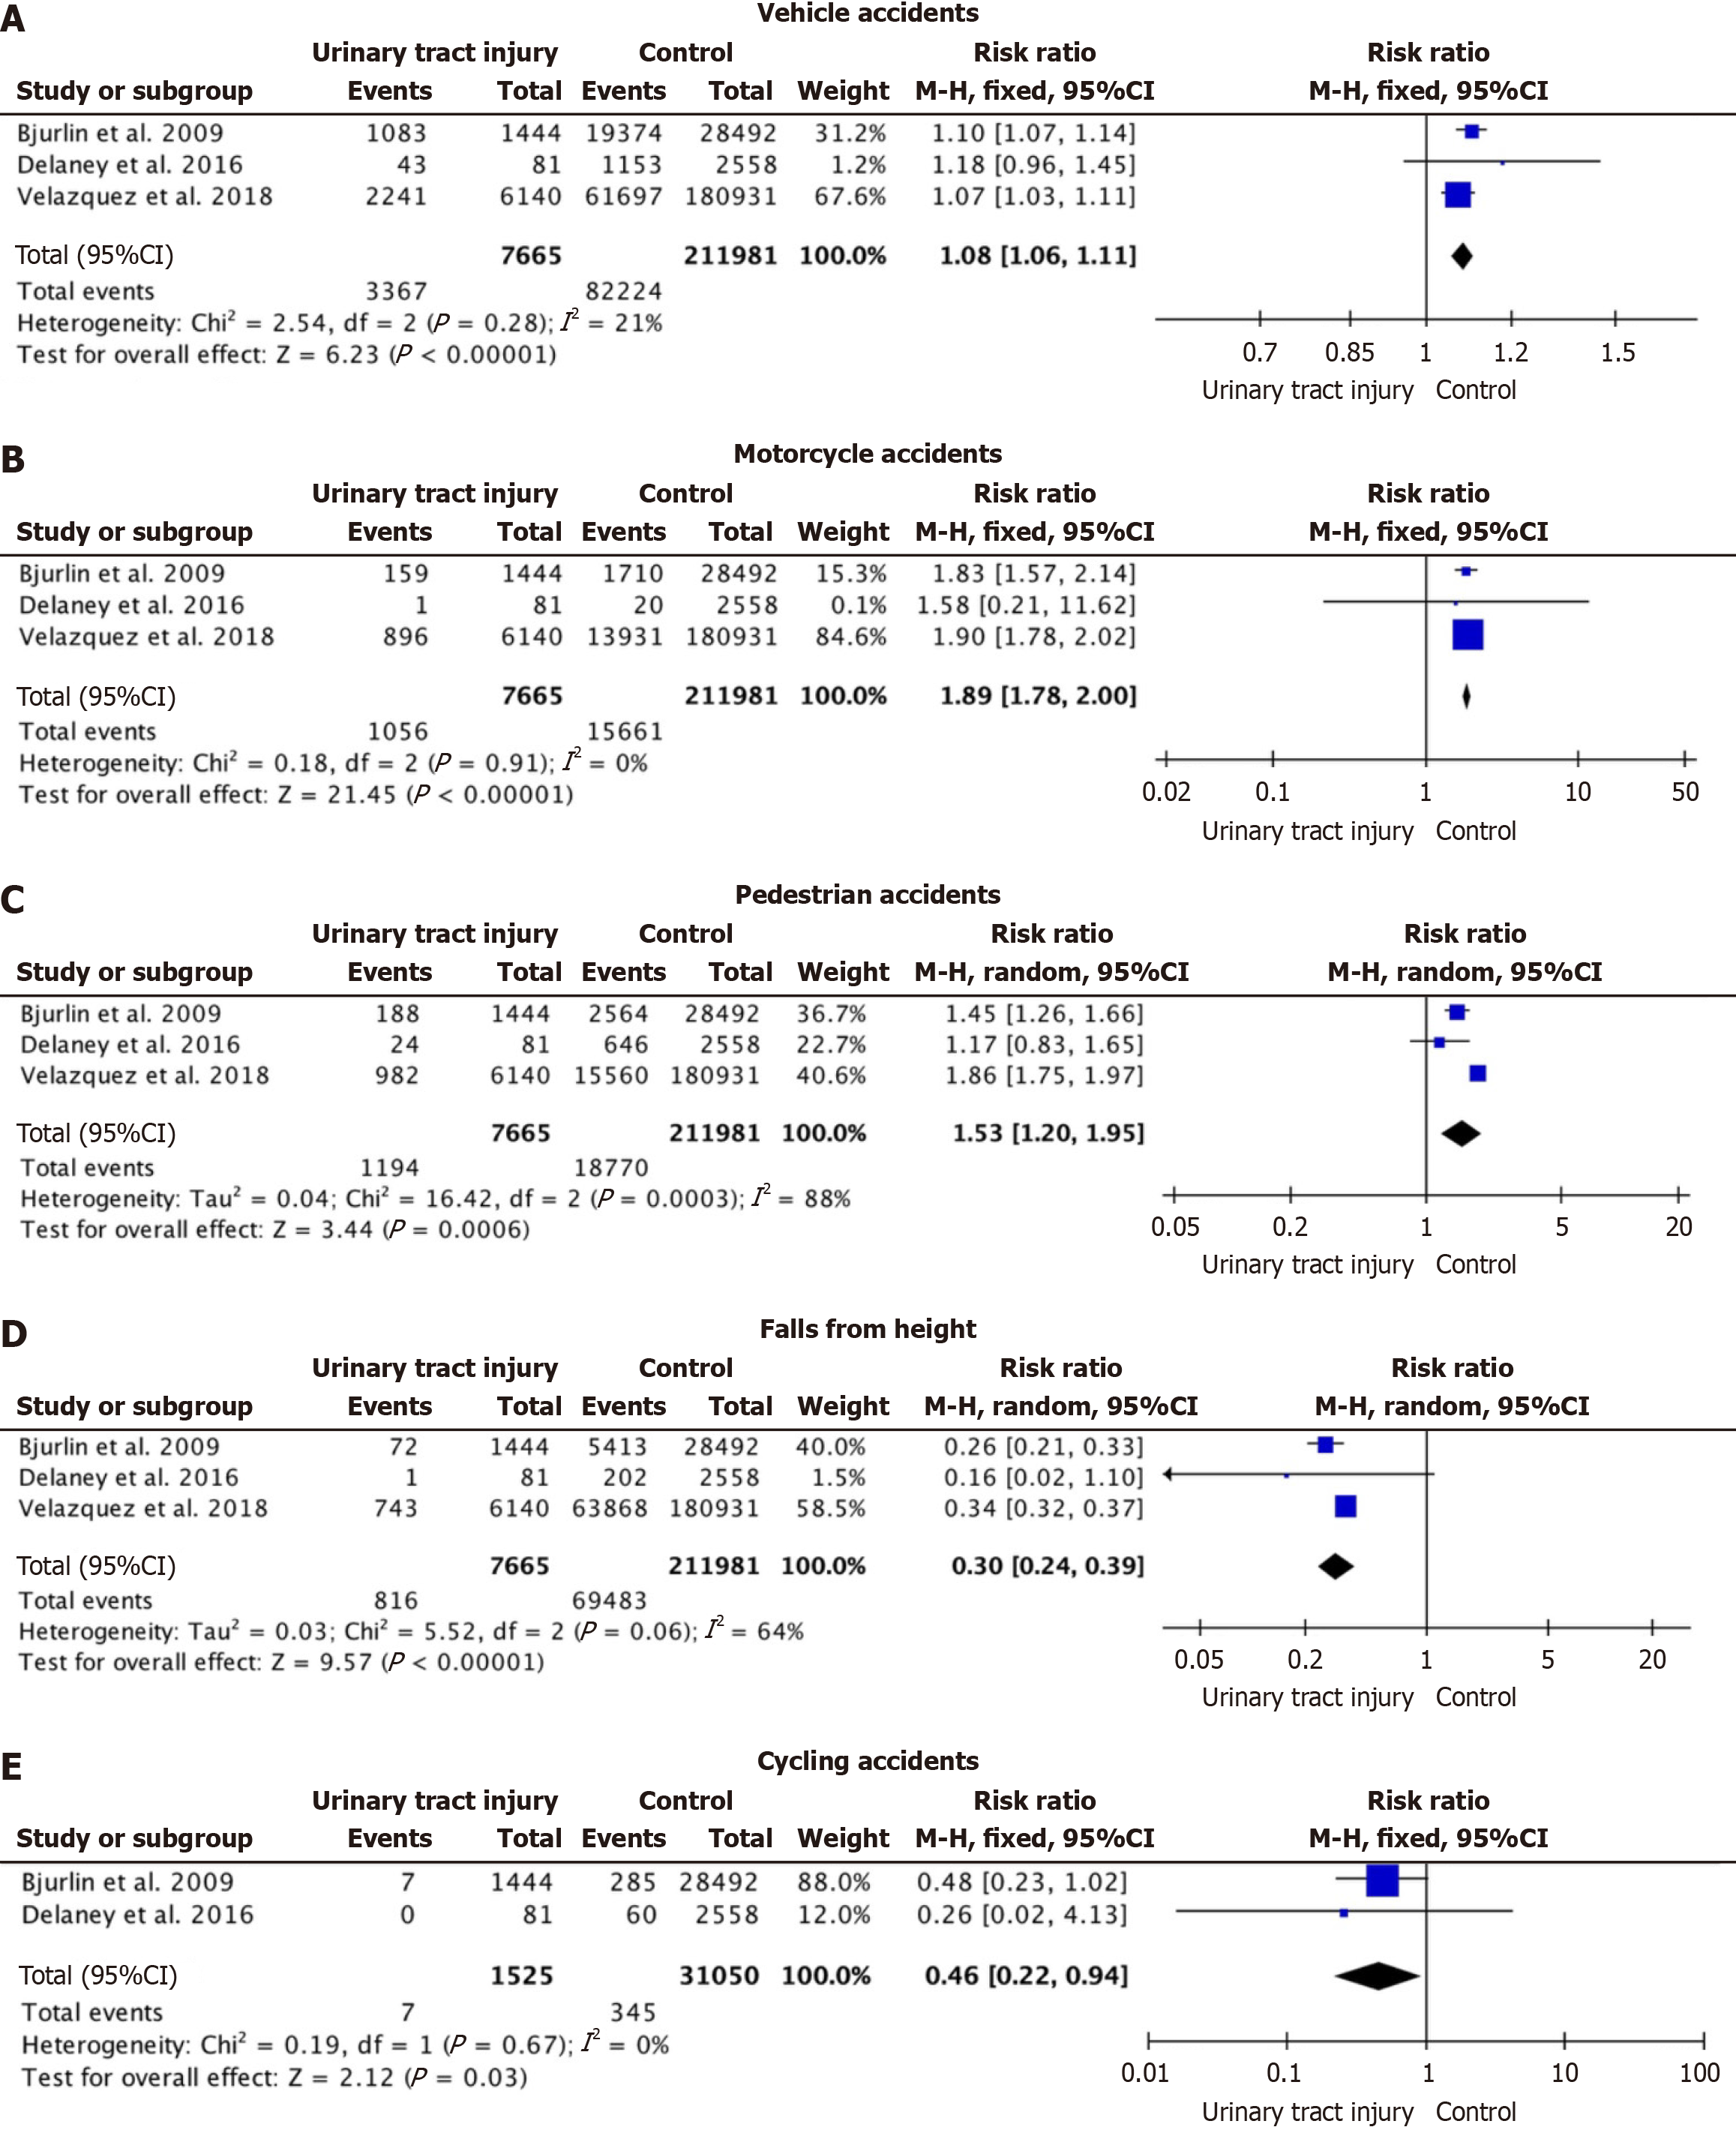
Figure 2 Forest plots showing the association between mechanism of injury and urinary tract injury in patients with pelvic fractures.
The forest plots display the relative risk (RR) of urinary tract injury for different mechanisms of injury. A: Vehicle accidents; B: Motorcycle accidents; C: Pedestrian accidents; D: Falls from height; E: Cycling accidents. The squares represent the point estimate of the RR for each study, with the size of the square proportional to the study's weight in the meta-analysis. The horizontal lines represent the 95%CI. The diamond represents the pooled RR, with its width representing the 95%CI.
- Citation: Mariscal G, Dway A, Barrios C. Hidden dangers of pelvic fracture: A meta-analysis on urinary tract injury incidence and risk factors. World J Orthop 2025; 16(2): 102483
- URL: https://www.wjgnet.com/2218-5836/full/v16/i2/102483.htm
- DOI: https://dx.doi.org/10.5312/wjo.v16.i2.102483


