Copyright
©The Author(s) 2024.
World J Orthop. Feb 18, 2024; 15(2): 170-179
Published online Feb 18, 2024. doi: 10.5312/wjo.v15.i2.170
Published online Feb 18, 2024. doi: 10.5312/wjo.v15.i2.170
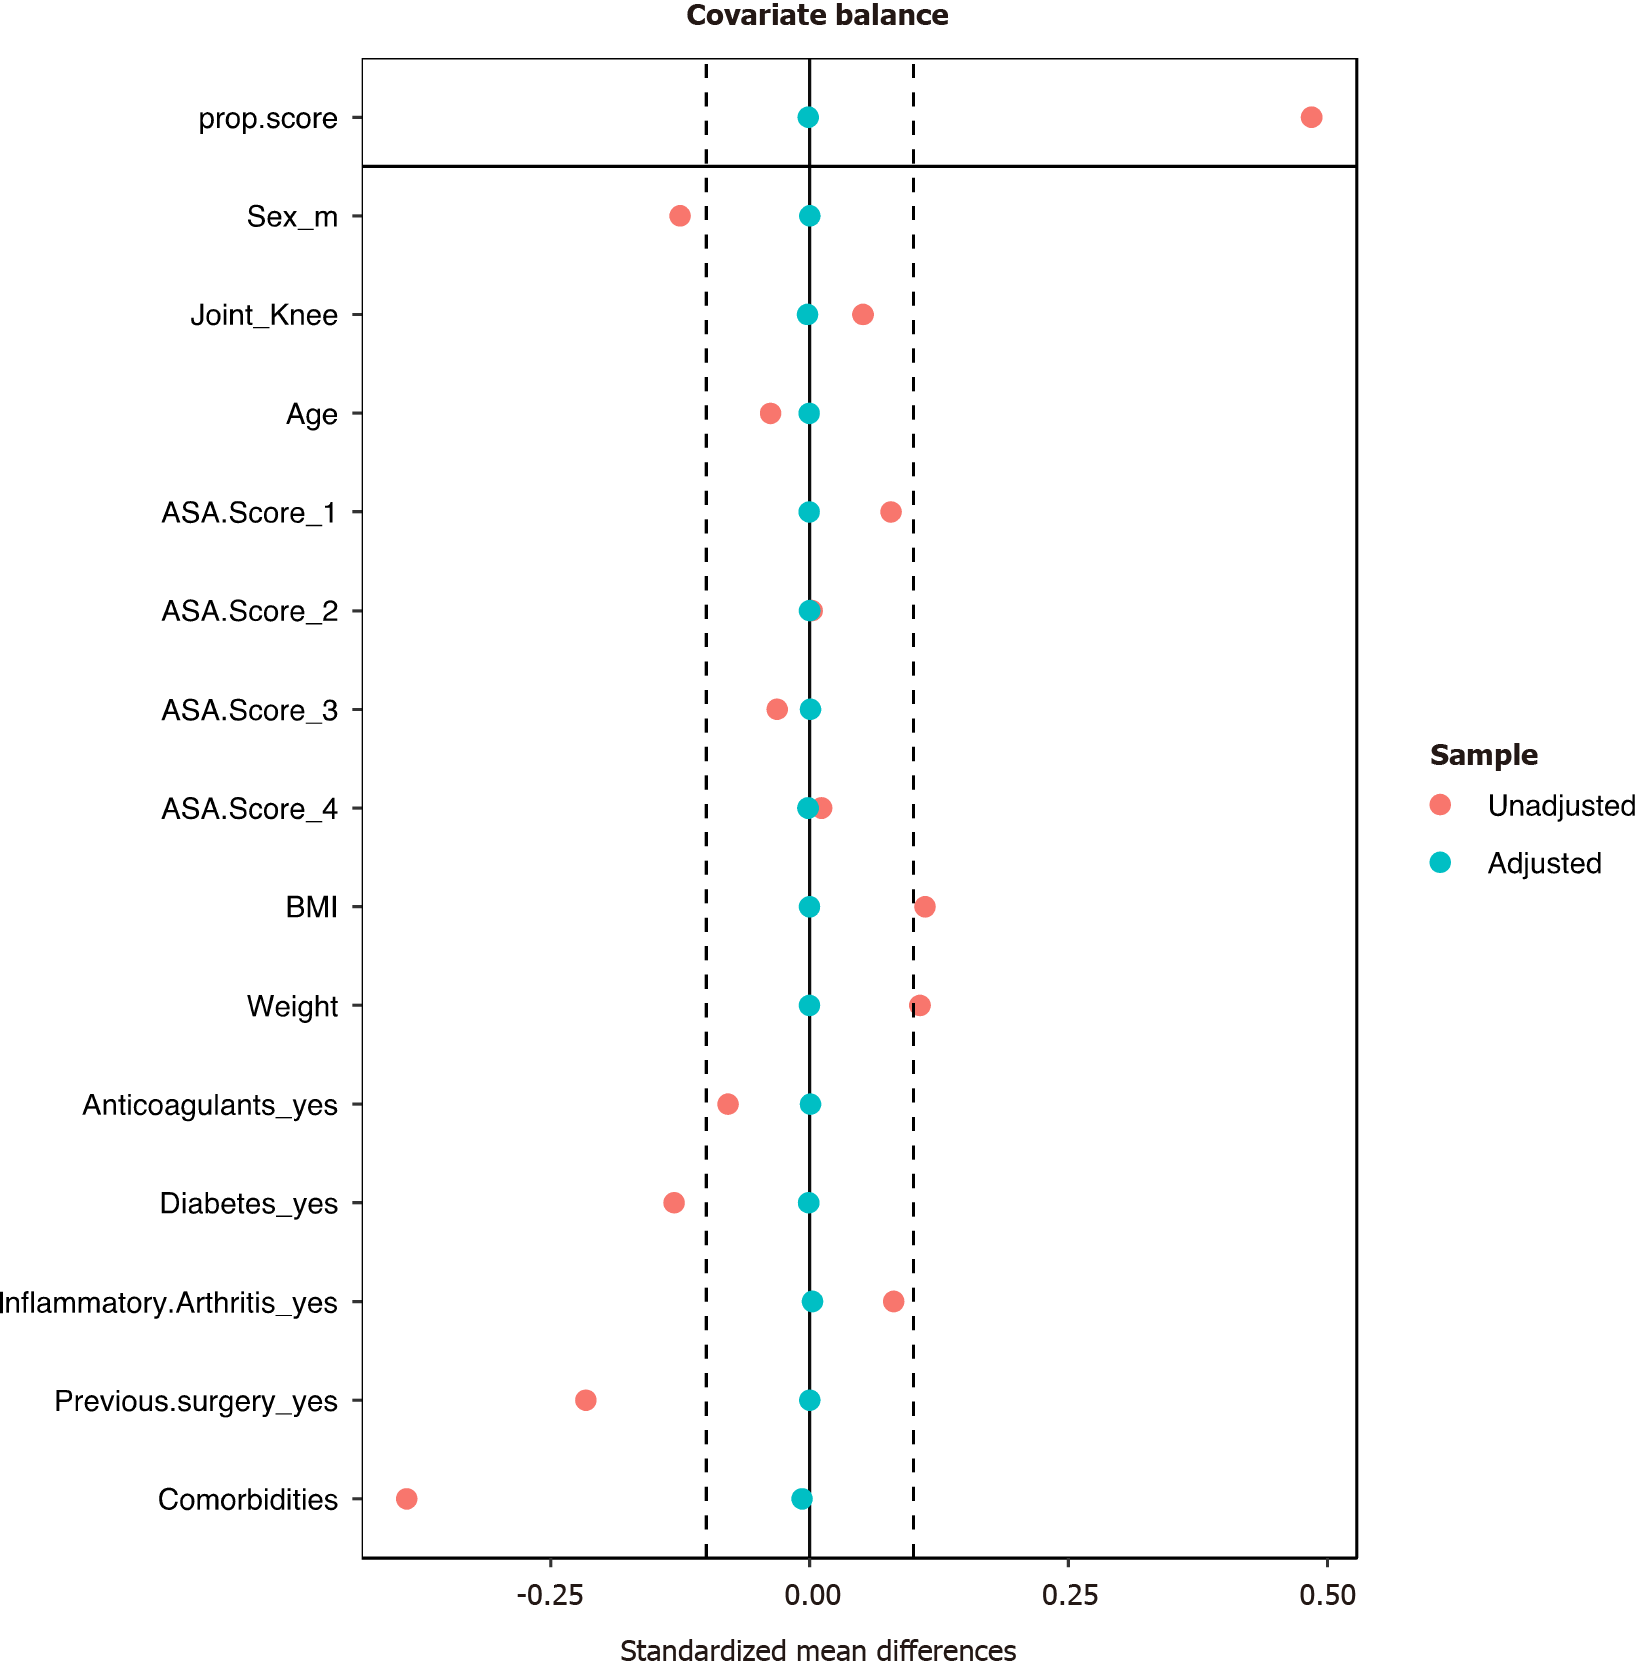
Figure 1 Balance plot showing standardized mean differences in covariate values between the two regimes before (unadjusted) and after (adjusted) propensity score weighting.
The vertical dashed lines represent the boundary of meaningful baseline bias.
- Citation: Okoro T, Wan M, Mukabeta TD, Malev E, Gross M, Williams C, Manjra M, Kuiper JH, Murnaghan J. Assessment of the effectiveness of weight-adjusted antibiotic administration, for reduced duration, in surgical prophylaxis of primary hip and knee arthroplasty. World J Orthop 2024; 15(2): 170-179
- URL: https://www.wjgnet.com/2218-5836/full/v15/i2/170.htm
- DOI: https://dx.doi.org/10.5312/wjo.v15.i2.170


