Copyright
©The Author(s) 2024.
World J Orthop. Dec 18, 2024; 15(12): 1155-1163
Published online Dec 18, 2024. doi: 10.5312/wjo.v15.i12.1155
Published online Dec 18, 2024. doi: 10.5312/wjo.v15.i12.1155
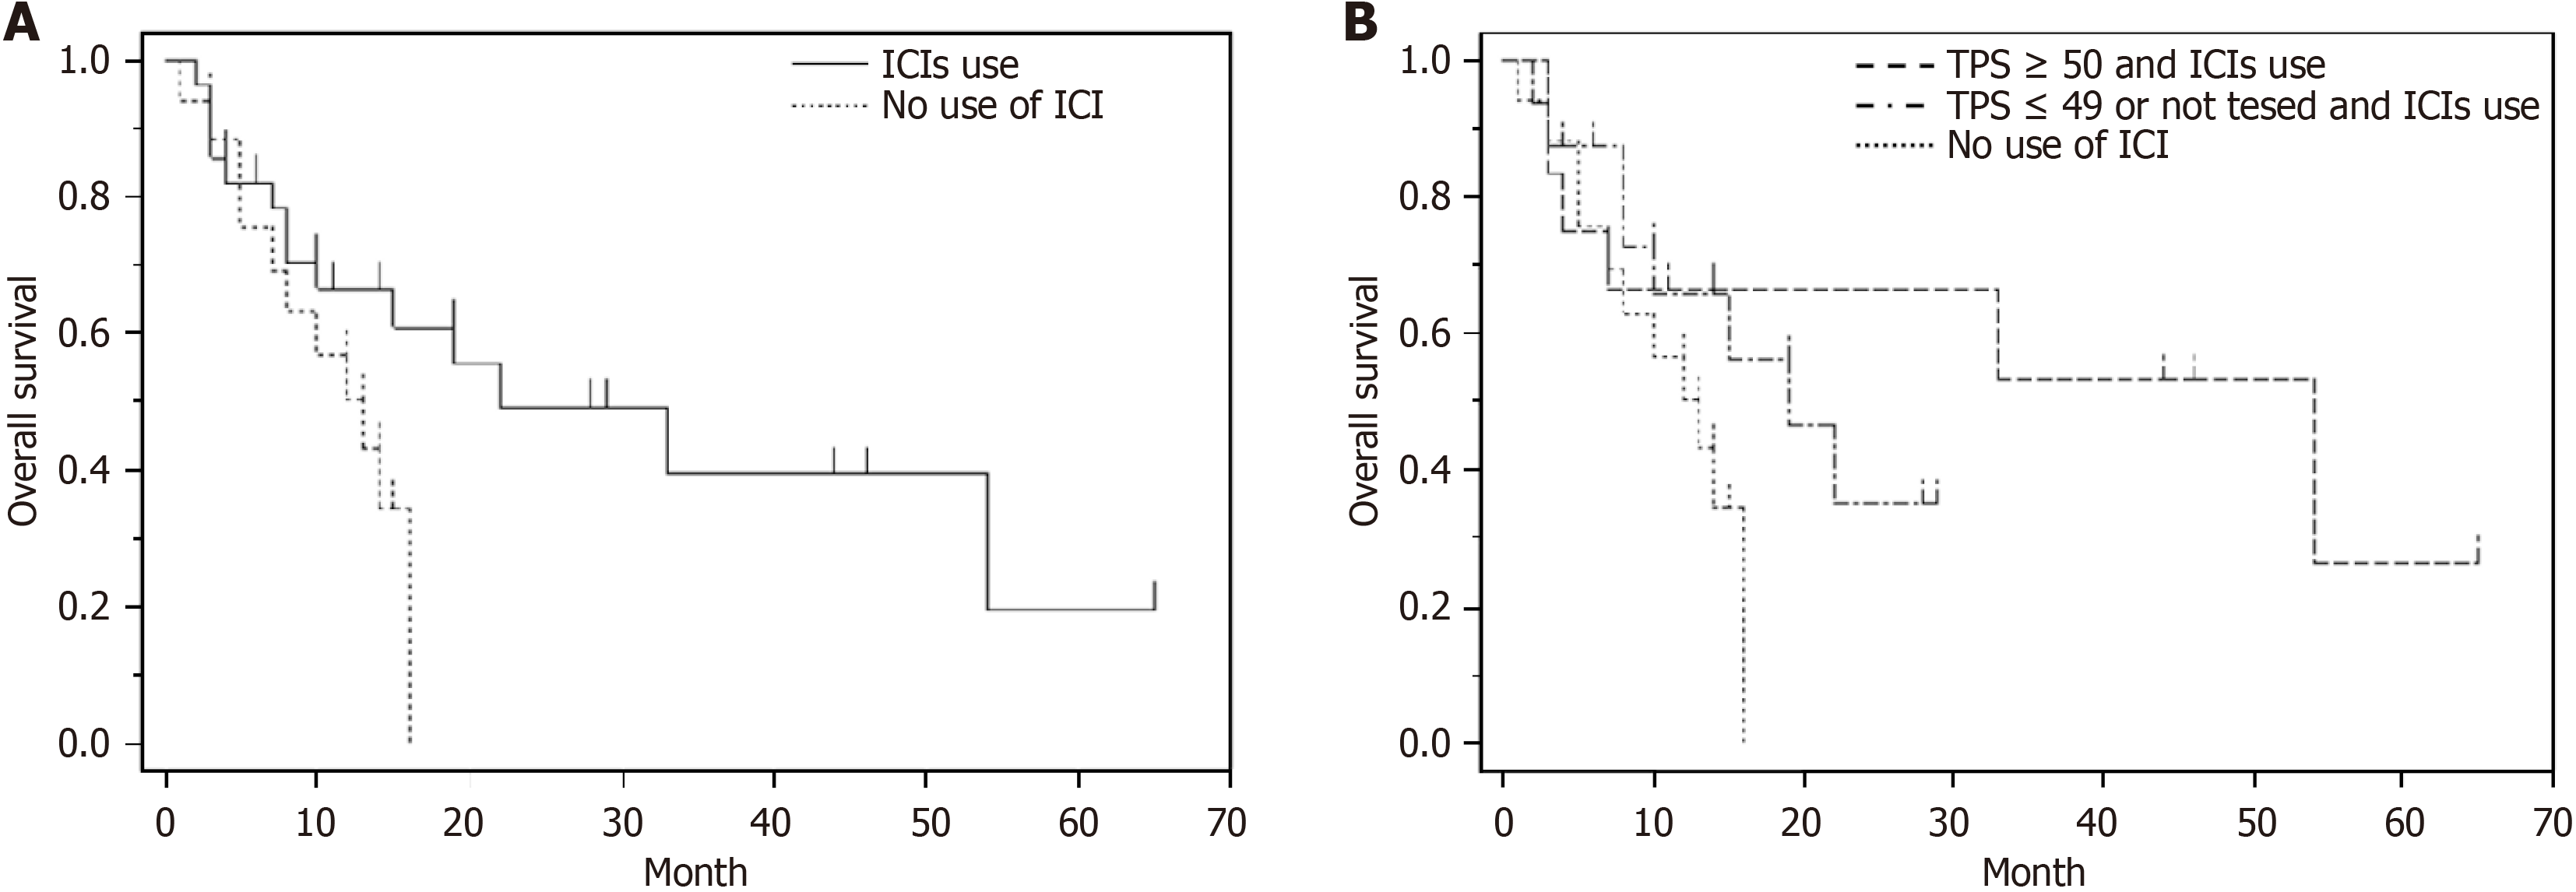
Figure 2 The Kaplan–Meier curves for overall survival of patients.
A: The Kaplan–Meier curves for overall survival of patients classified according to immune checkpoint inhibitor use; B: The Kaplan–Meier curves for overall survival of patients classified according to tumor proportion score and immune checkpoint inhibitor use. TPS: Tumor proportion score; ICI: Immune checkpoint inhibitor.
- Citation: Ishibashi Y, Kobayashi H, Ando T, Okajima K, Oki T, Tsuda Y, Shinoda Y, Sawada R, Tanaka S. Prognostic factors in patients with bone metastasis of lung cancer after immune checkpoint inhibitors: A retrospective study. World J Orthop 2024; 15(12): 1155-1163
- URL: https://www.wjgnet.com/2218-5836/full/v15/i12/1155.htm
- DOI: https://dx.doi.org/10.5312/wjo.v15.i12.1155


