Copyright
©The Author(s) 2020.
World J Orthop. Mar 18, 2020; 11(3): 167-176
Published online Mar 18, 2020. doi: 10.5312/wjo.v11.i3.167
Published online Mar 18, 2020. doi: 10.5312/wjo.v11.i3.167
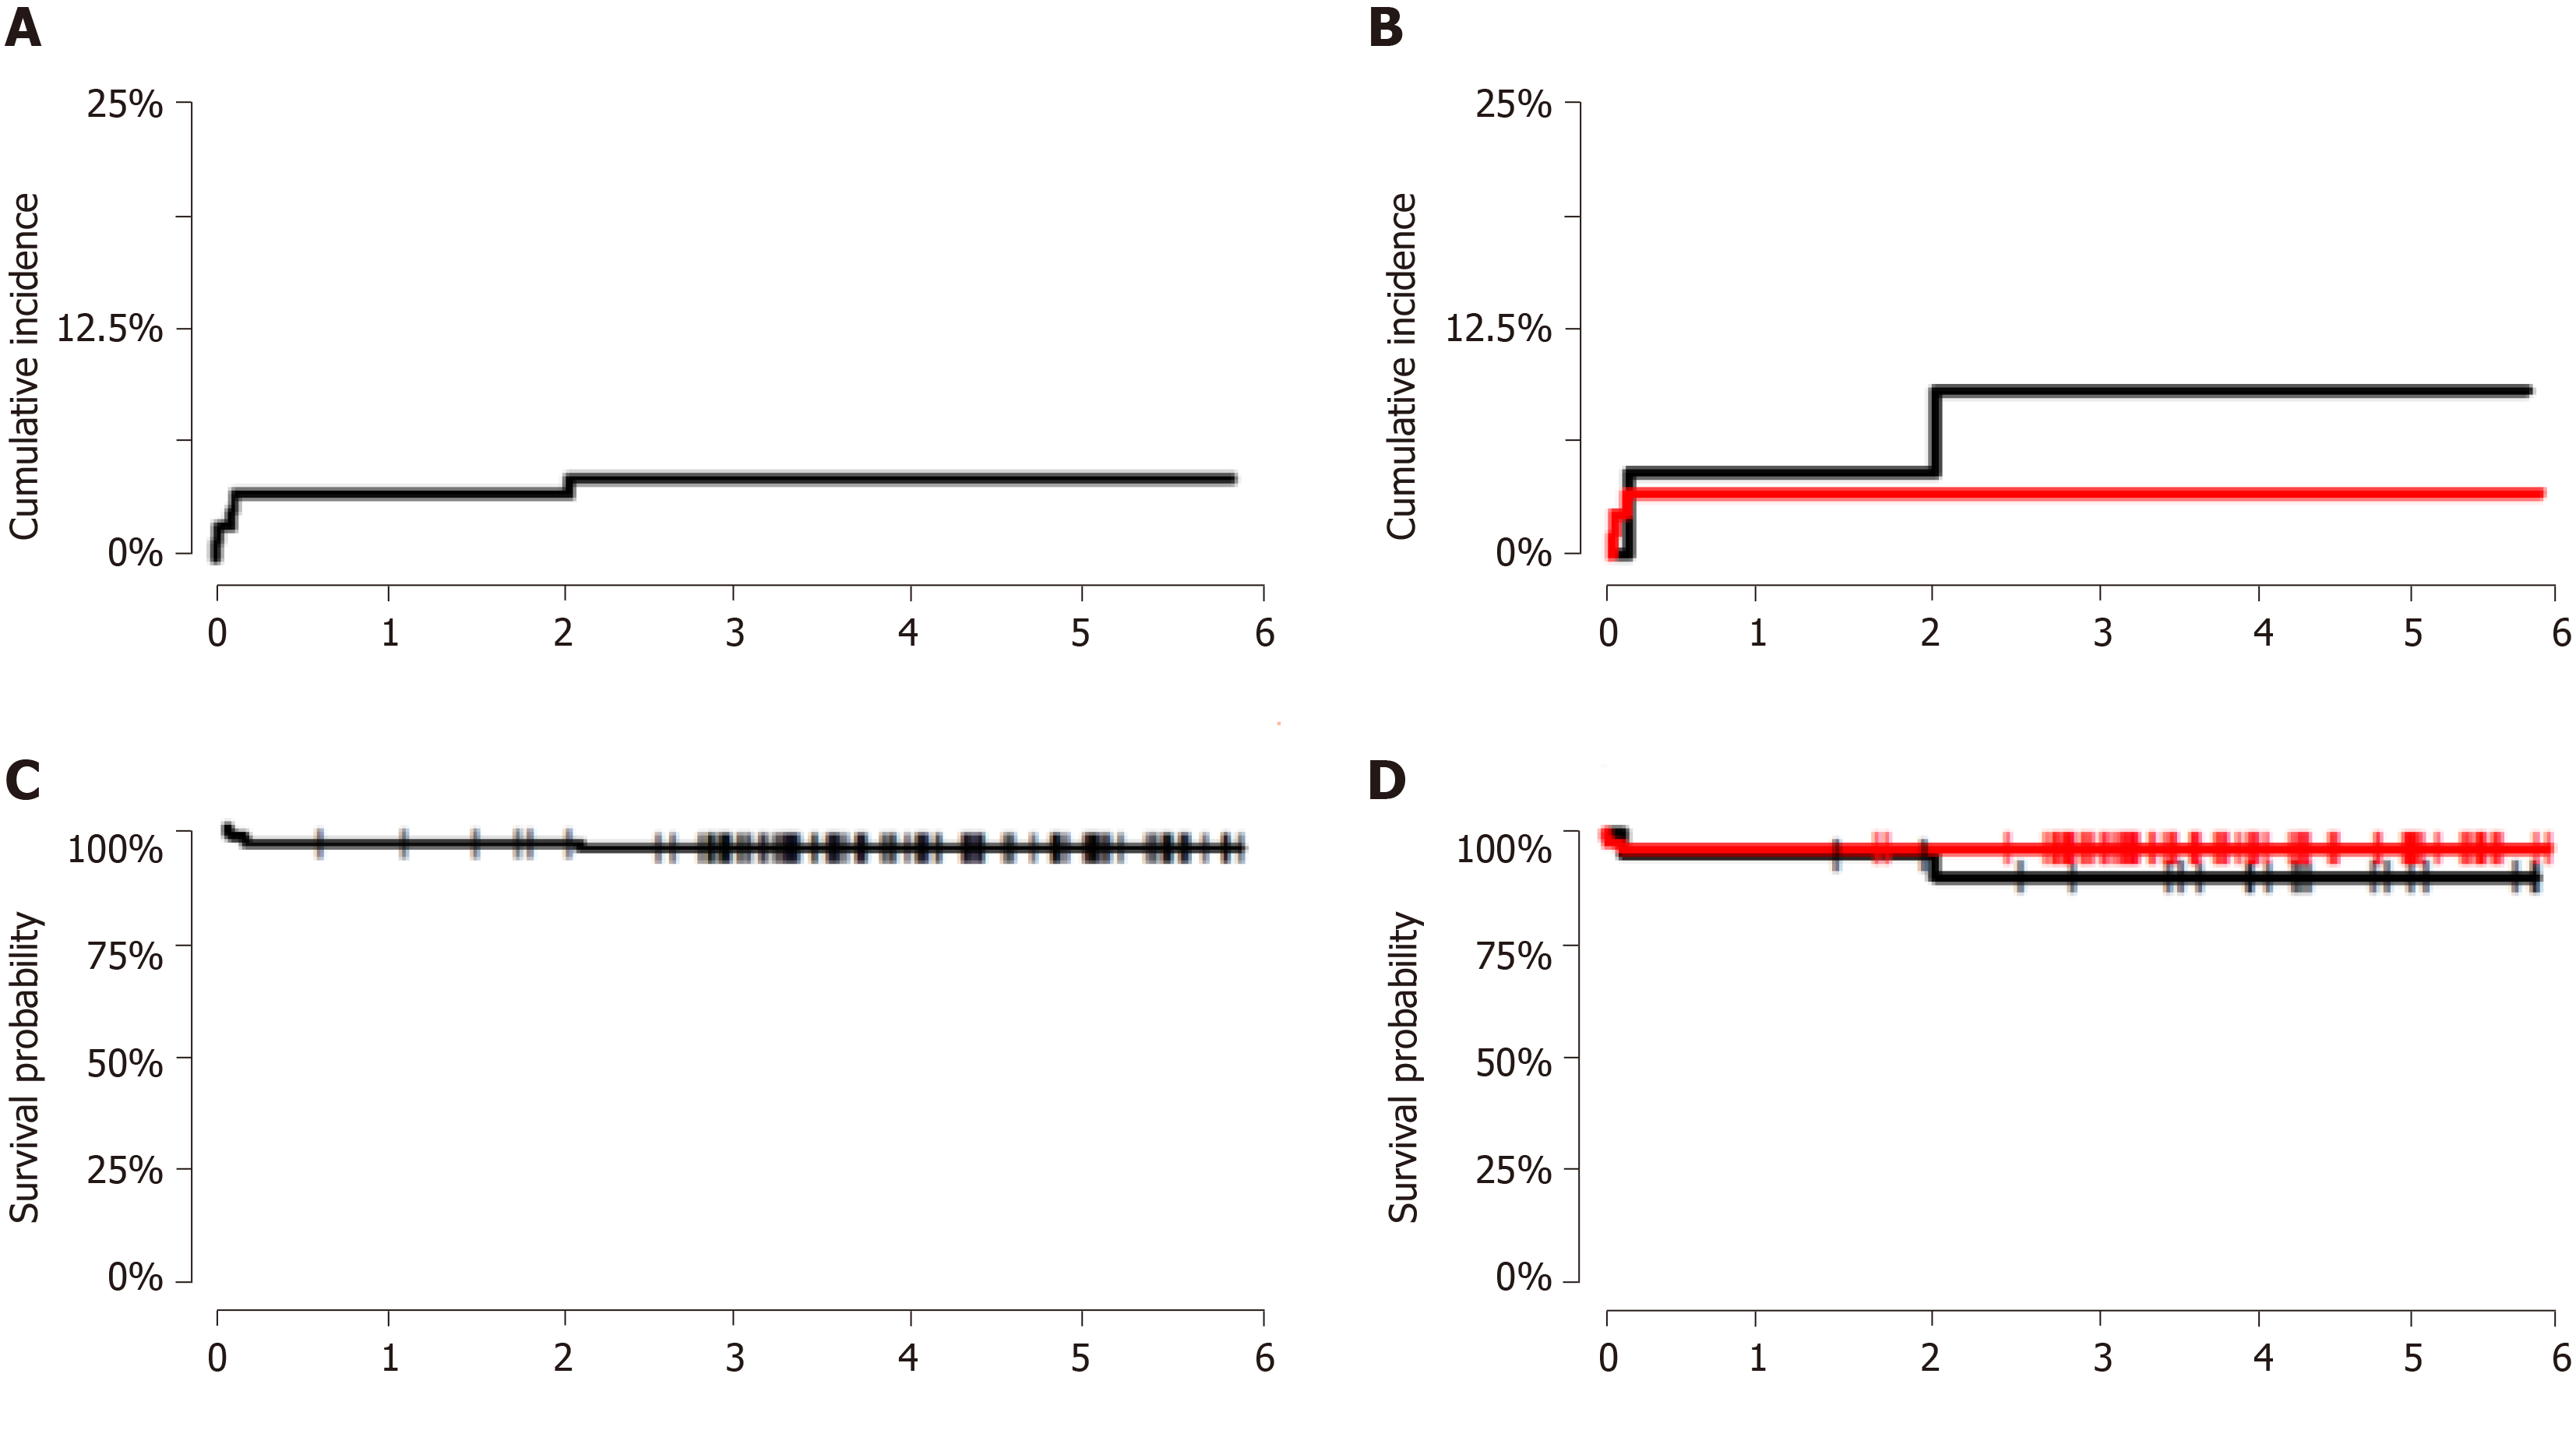
Figure 4 The X-axes represents years from operation.
A: Competing risk analysis, all; B: Competing risk analysis (red: Broach + slotted; black: Other combinations); C: Kaplan Meier, all; D: Kaplan Meier (red: Broach + slotted; black: Other combinations).
- Citation: Dyreborg K, Petersen MM, Balle SS, Kjersgaard AG, Solgaard S. Observational study of a new modular femoral revision system. World J Orthop 2020; 11(3): 167-176
- URL: https://www.wjgnet.com/2218-5836/full/v11/i3/167.htm
- DOI: https://dx.doi.org/10.5312/wjo.v11.i3.167


