Copyright
©The Author(s) 2019.
World J Orthop. Dec 18, 2019; 10(12): 434-445
Published online Dec 18, 2019. doi: 10.5312/wjo.v10.i12.434
Published online Dec 18, 2019. doi: 10.5312/wjo.v10.i12.434
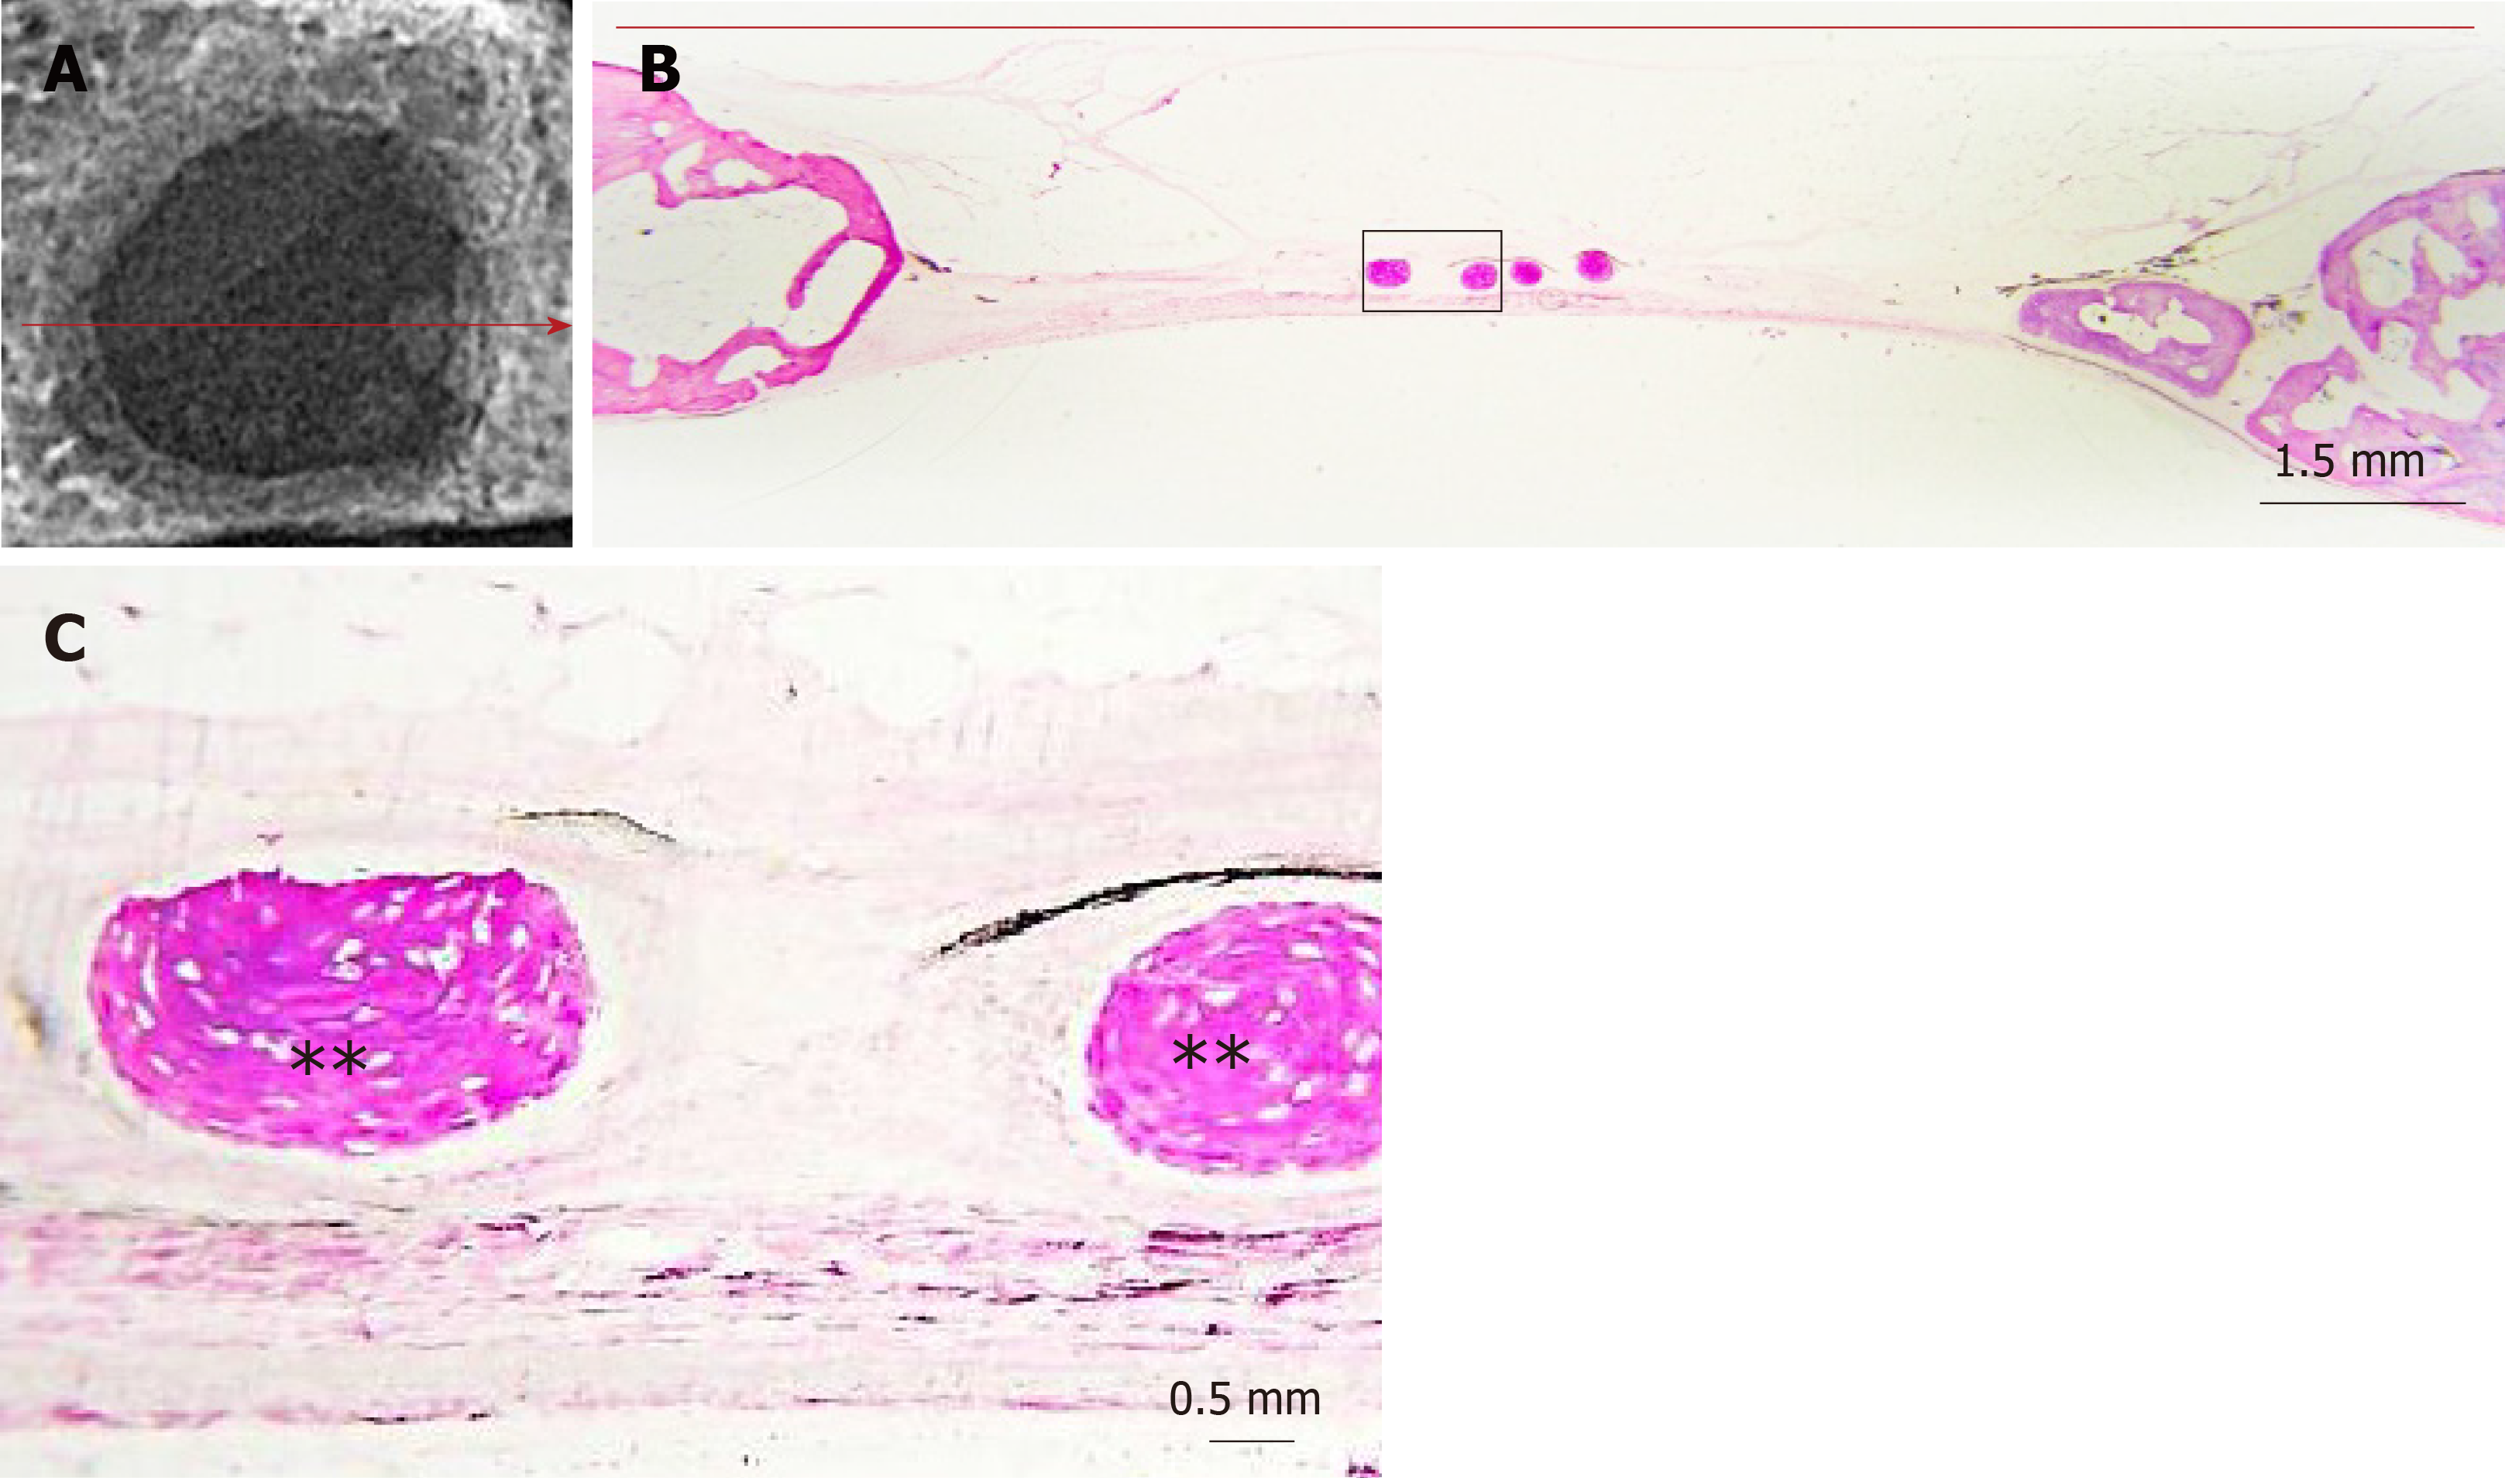
Figure 6 Representative specimen from the control group.
A: Planar radiographic image of the defect (red arrow showing the direction of histological section; scale bar is 1.5 mm); B: Histological section (red arrow showing the direction of histological section; scale bar is 1.5 mm); C: Higher magnification in the central part of the defect showing new formed bony islet consisting of woven bone (asterisks, scale bar is 0.05 mm).
- Citation: Lillis T, Veis A, Sakellaridis N, Tsirlis A, Dailiana Z. Effect of clopidogrel in bone healing-experimental study in rabbits. World J Orthop 2019; 10(12): 434-445
- URL: https://www.wjgnet.com/2218-5836/full/v10/i12/434.htm
- DOI: https://dx.doi.org/10.5312/wjo.v10.i12.434


