Copyright
©The Author(s) 2019.
World J Orthop. Dec 18, 2019; 10(12): 434-445
Published online Dec 18, 2019. doi: 10.5312/wjo.v10.i12.434
Published online Dec 18, 2019. doi: 10.5312/wjo.v10.i12.434
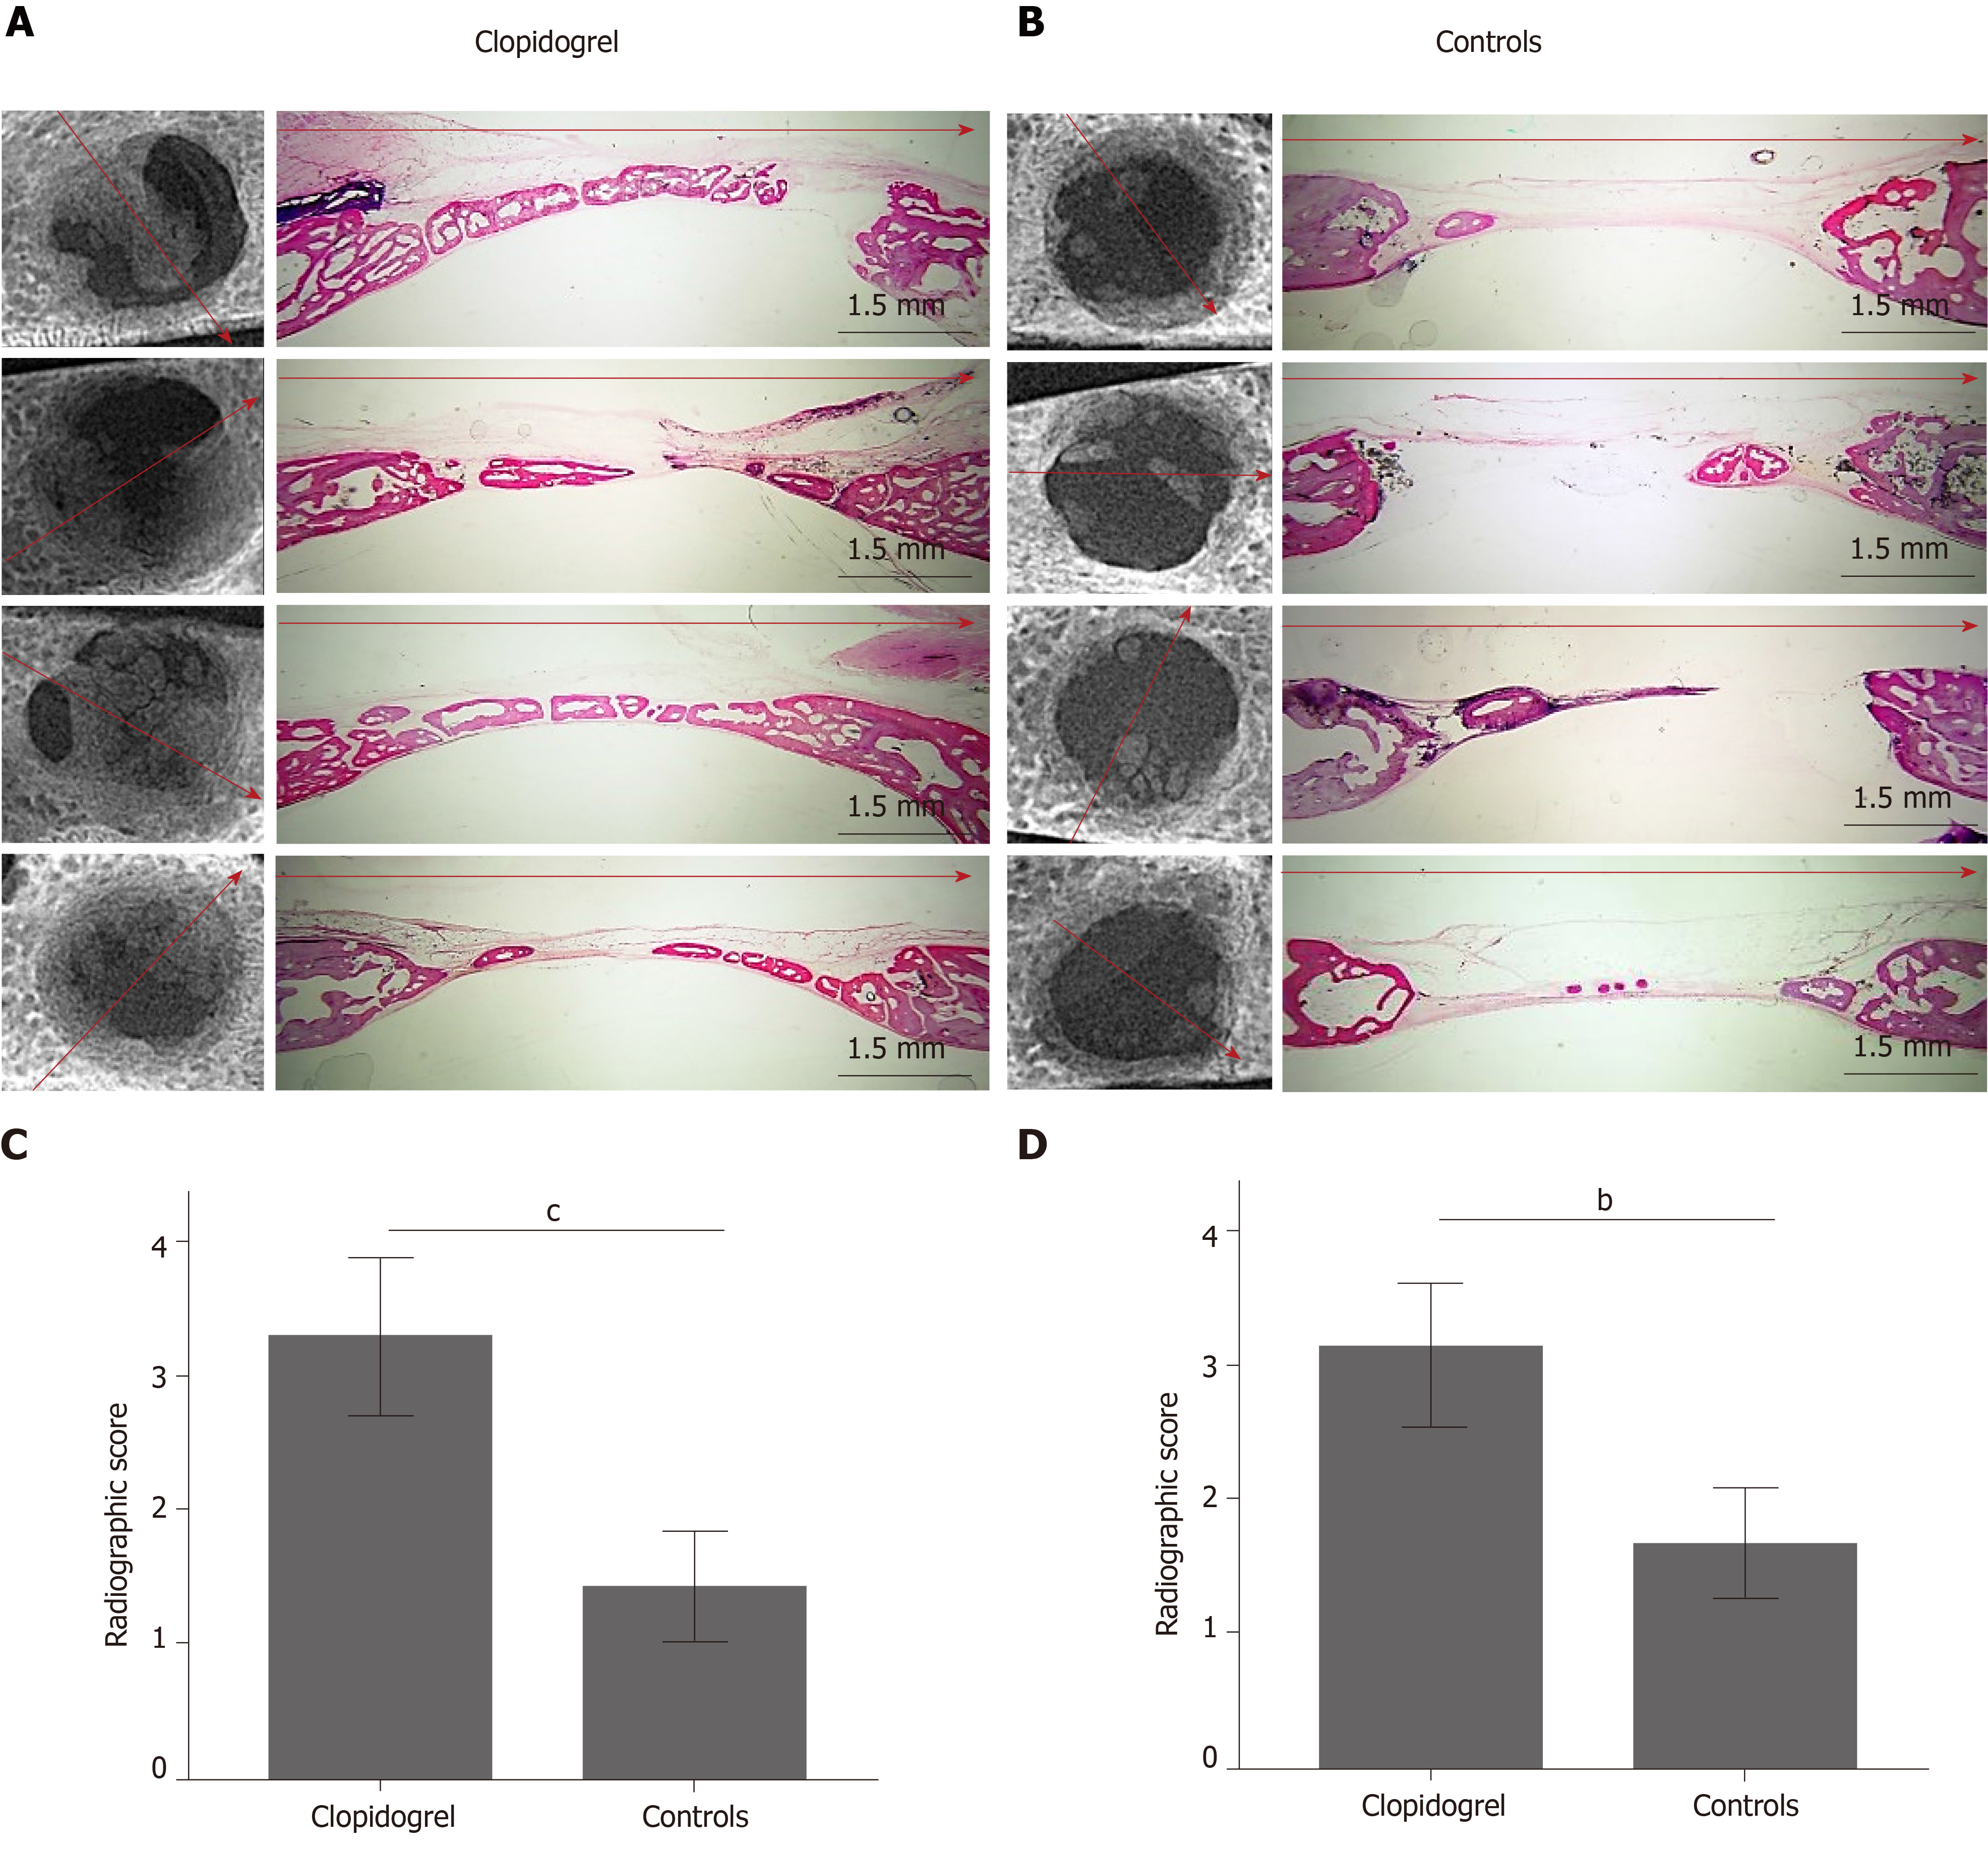
Figure 4 Representative radiographs and histological sections of the defects at 6 wk postoperatively.
A: Clopidogrel group (red arrows showing the direction of histological section in each defect); B: Control group (red arrows showing the direction of histological section in each defect); C: Radiographic scoring from examiner A (cP < 0.001); D: Radiographic scoring from examiner B (bP < 0.01); scale bar of all histological figures is 1.5 mm.
- Citation: Lillis T, Veis A, Sakellaridis N, Tsirlis A, Dailiana Z. Effect of clopidogrel in bone healing-experimental study in rabbits. World J Orthop 2019; 10(12): 434-445
- URL: https://www.wjgnet.com/2218-5836/full/v10/i12/434.htm
- DOI: https://dx.doi.org/10.5312/wjo.v10.i12.434


